Tag: Research

  • A History of XR Cross Reality Part 1 of 6

    A History of XR Cross Reality Part 1 of 6


    Decorative image showing scenes from the history of XR: Athens, The Aztec sun stone, and the Microsoft Hololens.

    “The longer you can look back, the farther you can look forward.” ~Winston Churchill.

    This
    the first of six articles describing a history of cross reality,
    otherwise known as mixed reality or XR, which encompasses the fields of
    virtual reality (VR), augmented reality (AR), and virtual worlds (VW). I
    have used the lens of science fiction as my time travel machine. This
    is not meant as an exhaustive history, as I purposely chose my timeline.
    Also in this effort, I engaged pattern-seeking from design research to
    sharpen my prediction skills.

    These articles started with two
    recent research efforts: 1) an invitation to present on any topic at a
    local university and 2) a project to forecast the future of XR
    technology. As a result, I decided to craft a story, the history of XR.

    Said another way, there is a reason this article series is called “A History…”. It is because it is one chosen history. 

    There are many possible others. For example, some will trace a purely technological history and start with Morton Heilig’s Sensorama device. Others will trace the use of alternative realities and perhaps start with flight simulators.

    When I went to find the origins of science fiction, my research indicated that I should start first with paleo futurism. Paleo futurism
    is the study of how, in the past, we envisioned the future. Said
    another way, we have guessed about the future before. How good are we at
    guessing? Once I did some research in paleo futurism, I found that I needed to look to utopian/dystopian literature as the origins of alternative realities in human thought.  

    Photo of Athens showing the Acropolis and surrounding trees on the hillside.
    Photo by Constantinos Kollias on Unsplash

    That brings our time machine’s first stop back to 380 B.C. and Plato’s Republic.

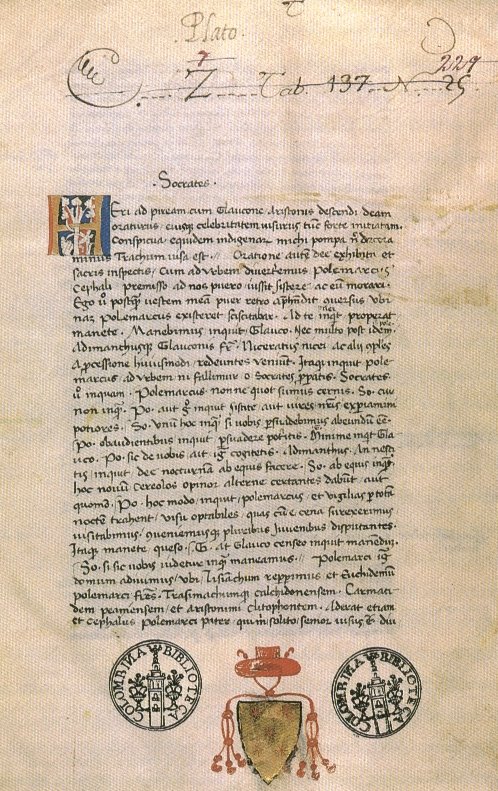
    Photo of a page from Plato's Republic.
    Public Domain, https://commons.wikimedia.org/w/index.php?curid=1181161


    This
    is argued to be the first instance of humankind writing about an
    alternative reality for themselves. Plato focused this reality not on
    city planning or public education, but on the concept of justice. Plato
    pitted 4 different definitions of justice against each other to see how
    humanity fared. At least up until 1900, it is a very strong bet that
    the rest of our science fiction sources know of this foundation.

    (Note:
    there may be non-Western roots of alternative realities that go further
    back than 380 B.C. My choice to start with Plato simply reflects a place
    where I was comfortable starting.)

    Our next stop is the early 1500s A.D. What was happening on Earth?

    Columbus
    had made 2 journeys to the “New World” Undoubtedly, knowledge that new
    lands had been discovered was spreading across Europe. The slave trade
    had begun.

    Drawing by Theodor de Bry, dated 1594 of Columbus discovering the New World. It depicts a tonal drawing of a single armor-clad person looking out into a sea-serpent-filled ocean towards distant lands.
    Bry, Theodor de,, Public domain, via Wikimedia Commons

    The Pacific Ocean had just been discovered.

    Globalism is on the rise. Colonialism is not far behind.

    In
    1516, under King Henry the 8th, Brian Tuke was established as the first
    Master of the Posts, the progenitor of the Royal Mail.

    In Germany, a law established that only water, barley, and hops are the allowed ingredients to make beer.

    In
    China, the Nantan meteorite fell to Earth. The fall of this meteorite
    was eye-witnessed by a farmer in a field and it was a rare iron-nickel
    meteorite.

    One of the final battles for the Holy Land was won by the Ottomans, establishing the Ottoman empire.

    The
    Aztecs were in their post classical period. This image is from the
    Aztec sun stone, showing the belief in a cyclical calendar. We’ll see
    cycles later as a key to prediction.

    Photo of the Aztec Sun Stone, thought to have been carved around 1521.
    Gary Todd, CC0, via Wikimedia Commons

    The
    first social housing was established in Bavaria—which still exists
    today. Originally to live here, you had to have been a city resident for
    the two prior years, have no source of income, and be a
    Catholic. Widowed mothers were the primary residents.

    In Venice, the first Jewish ghetto was established by law.

    In
    Florence, the first uffizi (office) was established for workers to come
    to on a daily basis to do their work for the first “corporation.”

    Photo of the Firenze in Florence, Italy. The text argues that this was the first office.
    Txllxt TxllxT, CC BY-SA 4.0 <https://creativecommons.org/licenses/by-sa/4.0>, via Wikimedia Commons


    I’ve brought up all of these elements to show that humanity was in flux, in a period of change when new ideas were flooding many different cultures.

    Then, in 1516 Thomas More published Utopia, the progenitor of science fiction.

    Photo of an original version of Thomas More's Utopia book.
    The Folger Shakespeare Library, CC BY-SA 4.0 <https://creativecommons.org/licenses/by-sa/4.0>, via Wikimedia Commons

    As
    I researched, I learned that the definition of utopia was not our
    current meaning of perfection or “Eden.” Thomas More intended “Utopia”
    to mean “nowhere” or “a place that does not exist.” The book was a
    commentary that both supported and criticized socialism. Utopia had a
    ruler for life but after he died, there is an election for a new
    ruler. There was shared work, food, clothing, land, etc. Punishment for
    crime, however, was severe. We would not recognize More’s concept of
    justice today. Residents dug away at a peninsular to form the island of
    Utopia. Interestingly, Utopia is not isolated for there are still ships
    to other nations. 

    The very next year after Utopia was published,
    Martin Luther nailed his 95 theses to the cathedral door and Canada was
    discovered via the St. Lawrence River. This was a world deep in
    change: new worlds, new religions, globalization, and also segregation
    and slavery.

    So we have our foundation of humans engaging with alternative realities. On to Part 2.

    Part 1 380 B.C. to 1880 

    Part 2 1881 to 1909

    Part 3 1910 to 1965

    Part 4 1966 – 1998

    Part 5 1999 – 2013

    Part 6  2014 – Future

    #Quotes
    #WinstonChurchill #Reality #CrossReality #MixedReality #VirtualReality
    #AugmentedReality #VirtualWorlds #Design #Plato #Republic #Utopia
    #ThomasMore #1516 #Transmedia #XR #VR #AR #ARVRinEdu #EdTech #Innovation
    #Athens #Globalization #Change


    This article was originally posted to LinkedIn on November 17, 2019. Updated on February 24, 2026 with some slighted clarified writing, changed font, and re-added images.

    (more…)

  • Here we go again…

    Here we go again…

    Today’s entry in the XR and learning Hall of Shame isn’t an article, it’s literally what is being written as the summary of the article.  I can’t make this stuff up.  (And BoA was only last week, yo.)

    I did not capture the poster’s name on Facebook to protect privacy.  However, I’ll re-type their summary here:

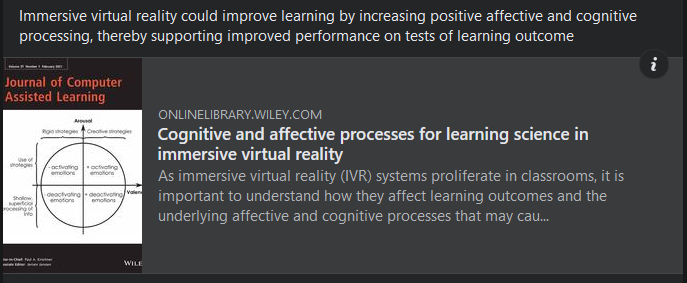
    Immersive
    virtual reality could improve learning by increasing positive affective
    and cognitive processing, thereby supporting improved performance on
    tests of learning outcome”

    and here is the article Abstract:

    As immersive virtual reality (IVR) systems proliferate in classrooms, it is important to
    understand how they affect learning outcomes and the underlying affective and cog-
    nitive processes that may cause these outcomes. Proponents argue that IVR could
    improve learning by increasing positive affective and cognitive processing, thereby
    supporting improved performance on tests of learning outcome, whereas opponents
    of IVR contend that it could hurt learning by increasing distraction, thereby disrupting
    cognitive learning processes and leading to poorer learning outcomes. In a media
    comparison study, students viewed a biology lesson either as an interactive animated
    journey in IVR or as a slideshow on a desktop monitor. Those who viewed the IVR
    lesson performed significantly worse on transfer tests, reported higher emotional
    arousal
    , reported more extraneous cognitive load and showed less engagement based
    on EEG measures than those who viewed the slideshow lesson, with or without prac-
    tice questions added to the lessons. Mediational analyses showed that the lower
    retention scores for the IVR lesson were related to an increase in self-reported extra-
    neous cognitive load and emotional arousal
    . These results support the notion that
    immersive environments create high affective and cognitive distraction, which leads
    to poorer learning outcomes than desktop environments. [Highlights added for emphasis]


    The article is free to read here: https://onlinelibrary.wiley.com/doi/epdf/10.1111/jcal.12482 but as of November 9, 2021, you cannot download or print this article.


    Basically the exact opposite of the summary written IS what the article is saying.  I’ll rewrite:

    Immersive
    virtual reality could not improve learning by increasing positive affective
    and cognitive processing, thereby not supporting improved performance on
    tests of learning outcome.


    I’ve just got one image to relay how this mis-reading of research makes me feel:


  • Research Writing is Like Baked Alaska

    Research Writing is Like Baked Alaska


    When I help students understand the basic reasoning behind research
    writing, I often say “Research writing is like Baked Alaska. Do you know
    what a Baked Alaska is?” I always get back a confused, laughing “No.”
    Purposely, I pick this food because:

    1. I am pretty sure few people have heard of it and I need to refer to something you don’t know before you do it and
    2. I just love the 1950s kitchen where cakes like this would have
      been the norm. I mean, ice cream inside a baked cake! And served by
      someone in pearls and an A-line skirt. Just imagine!

    But I’m getting off track. OK, back to writing.

    If I asked you to go make a Baked Alaska, what would be the first
    thing you would do? You would probably Google it. Totally OK. Everyone Googles. Asking questions is the first step.

    You might look ‘Baked Alaska’ up in several cookbooks. You would
    gather a few recipes that you would consider your main guides and you
    would keep rereading those recipes. Congratulations, you have started
    your literature review.

    You might look up several recipes and compare the ingredients, or
    the style of making. Do you have a nine inch pan or a ten inch pan? Does
    it matter? What if you want to use chocolate ice cream instead of
    strawberry? Is your oven big enough? Can you whip the meringue by hand
    or with a mixer? You are determining your methods.

    Once you head into the kitchen, do you start just randomly throwing
    flour, sugar, and eggs around hoping that a dessert will somehow
    happen? No. You carefully measure the ingredients in the proper order
    and follow the instructions. You are specifying your tools and techniques.

    You would keep at your baking until your food creation is complete.
    A wondrous cake, ice cream, and meringue dessert that you’d quickly
    take a photo of and post up to your social media accounts. You have
    communicated your results and conclusion.

    You have completed a research writing cycle. Just like with baking,
    you might have ideas to try to make Baked Alaska again. This time the
    oven needs to be hotter, or you will use sponge cake instead of yellow
    cake. You have joined the academy of researchers, asking questions, setting up experiments, gathering data, and communicating results.

    Well done! Congratulate yourself! And here, have a piece of this lovely thing called Baked Alaska.


    This article was originally posted to LinkedIn on November 22, 2018. This post was updated on April 3, 2026 with a better font and deletion of the missing images.

  • “What Happened When Student Brains — on VR — Were Scanned” is Analyzed.

    “What Happened When Student Brains — on VR — Were Scanned” is Analyzed.


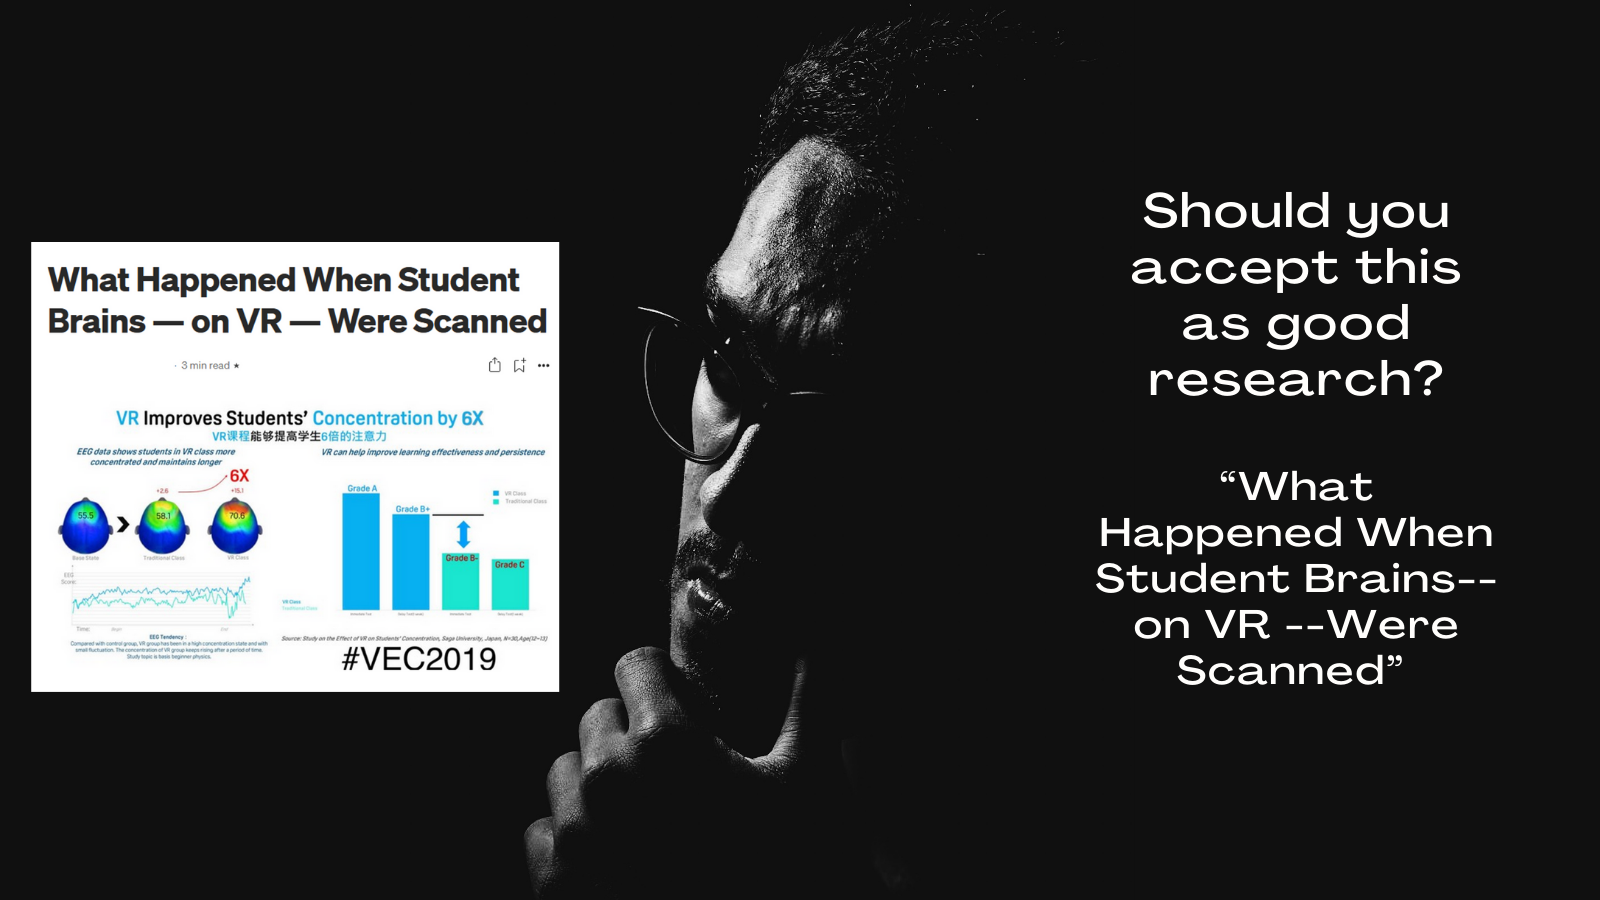
    Should you accept this, What Happened When Student Brains – on VR – Were Scanned, as good research?

    I believe that VR has a place in education.  We’ll get there and it will be awesome.

    However,
    along the way, I will analyze and call out poor virtual reality and
    learning research EVERY CHANCE I GET.  Poor research helps no one.

    I’ll be writing about several poor VR studies soon. I’m writing just like I did for my “Survey does NOT show that instructional designers drive better student outcomes.” 
    Even though poor research should be called out (yes!) I am NOT in the
    business of embarrassing or humiliating a person nor damaging or ending
    someone’s business.  Therefore, I will block out names as much as
    possible.  If the source blatantly has names within it though (for
    example, if someone names a company), I’ll keep that in the screen
    capture.  Note however, the minute time traveling teenagers arrive in my
    home office asking me to truly name names related to this, I AM SO
    TELLING THEM.

    Seat belt sign on.

    Image of airplane seatbelt on sign
    Seat belts on. It’s a bumpy ride ahead.

    On July 25, 2021, an author that I’ll call Author A posted this story to Medium: What Happened when student brains on VR were scanned
    Before you click on that link, remember that Medium is a site where
    authors are paid for article reads.  Now I post to Medium too (as a
    matter of fact, I’m posting this article there as a sort of rock’em
    sock’em method of seeing my article go head to head against his) but
    [EDIT: I no longer post to Medium] just bear in mind that the more you click, the more the author is paid.
    Author A appears to have posted 6 articles to Medium and 4 of them are
    about VR. (Update: during publication, this has increased, I’ll pick
    this point up again at the end of this article).

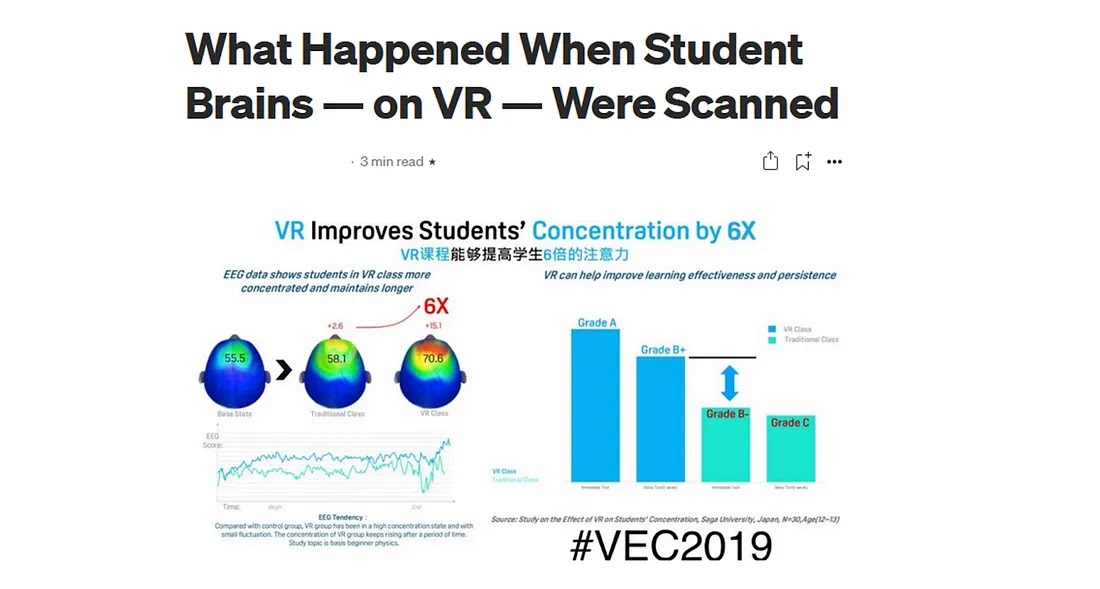
    Screen capture of Medium article from July 25, 2021 headline.  Article is titled "What Happened When Student Brains -- on VR -- Were Scanned"


    (July
    2021 version of this image, I’ve blocked the author’s account. Note the
    added #VEC2019.  I think it’s very obvious that the #VEC2019 was
    overlaid.

    VEC2019 is the VIVE Ecosystem Conference held in 2019.

    Inside the article, I did hope to find sources.

    Here is what I found (names blocked):


    Screen capture of a Medium article from  July 25, 2021

    In July 2021, Author A posted to their own LinkedIn account

    Partial capture of post here (blocked out the link and a name):

    Screen capture of a LinkedIn Post from July 30.

    While you are looking at this though, does anything stand out yet?

    Already for me:

    • The writing style feels like it’s pulling me along (FIRST, SECOND, THIRD) but I tend to like my separate points to be actually separate and new points
      If you look at what’s written for each item, the points are more
      chronological as if someone was talking than factual as if someone was
      listing.
    • I’m zinged by that “ [read the rest of the story here:  
      link    ]  That was actually written by the author, NOT hard coded in
      by LinkedIn. Bummer. I wish I had NOT clicked on the link but I
      sincerely thought that there was “the rest of the story” at the link. It
      was the Medium article link so by clicking on it, I “paid” this Author A
      some money.  This means something.  Stay tuned.
    • I do a quick
      mental check of the numbers in the post versus the image. As your math
      teachers always said “Stand back and look at the numbers. Do they make
      sense?”  The 4th bullet just further describes (aka says the same thing
      but with DIFFERENT numbers as the 3rd bullet so… is 15 roughly 6 times 
      2.5?  Yes. 
    • OK, the number “6X” checks out within the diagram
      (meaning that the data I’m provided with so far does align with the
      head/images).  However, your hackles should be going up because you
      should be asking yourself “Why was the image of the heads not enough? 
      Why do I need to be told– in red font with a drawn line– “six times”? 
      Answer: because the phrase “Six times” will stick in my head and slow
      down my reading and I will — as I’m sure MANY have done– quickly
      breeze over the “six times WHAT” part and read this to say:

    Six times more brain activity on VR

    Rather than what it says, which is

    The difference between the brain states is 6 times traditional.

    • See? 
      Didn’t you read this as “Wow, the brain is 6 times more active on VR,
      that’s got to be good!”  (VR and autism researchers right here are
      roiling; I can feel you. They are saying “An active brain isn’t
      necessarily a learning brain.”  Right on.  You get your chance coming up
      later.)
    • One further point I noticed later.  The “Traditional
      Class” is pulling a 58.1 (unitless) over a Base State of 55.5. That’s a
      2.6 difference. The image says 2.6, the writing says 2.5.  I’m willing
      to overlook this; that’s minor.  But think about it for a second. 
      Traditional class work is pulling nearly the same brain activity as
      “base state”.  So bad news teachers: your students in class are one tick over coma.  (I HOPE NOT!)
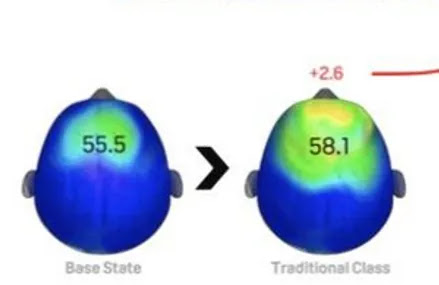


    In all my years of research, I NEVER found the original source of this image.

    I’m linked with Author A and that’s how I saw that this image was circulating again. 

    Author
    A linked to the Medium article within their post but they added this
    image to their LinkedIn post. Therefore, the image appears prominently
    like this:
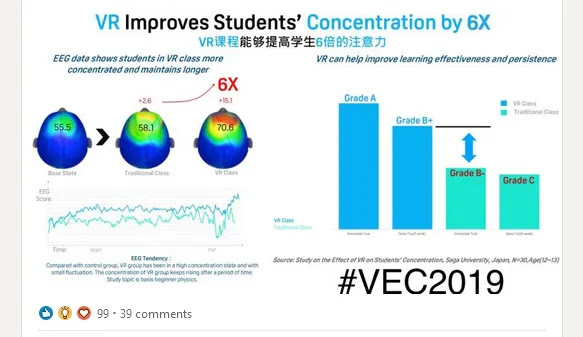
    LinkedIn post with image “VR Improves Students’ Concentration by 6X”. Image includes some Chinese characters and #VEC2019.

    Here is a version of the same image from 2020.
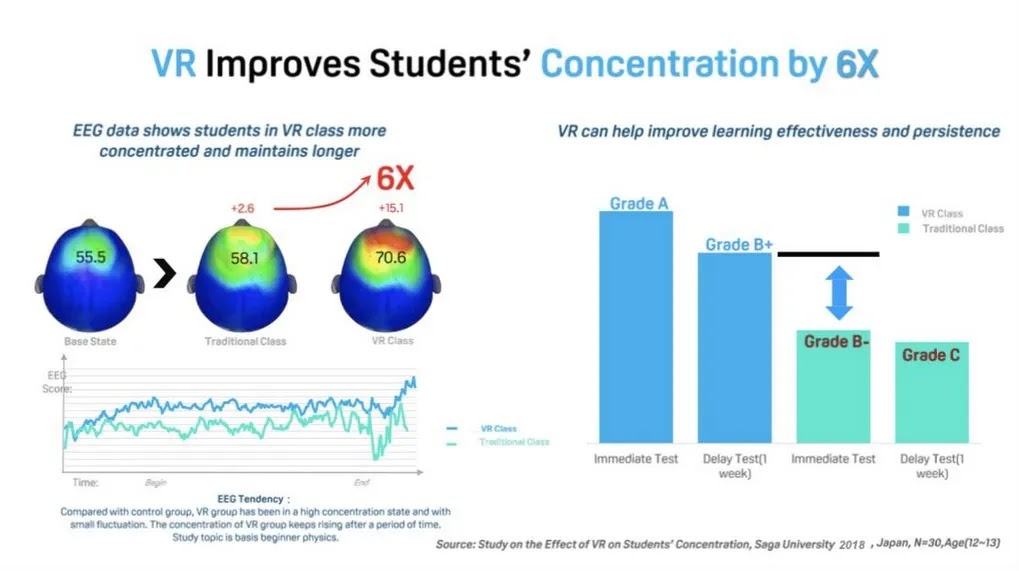
     

    LinkedIn post with image “VR Improves Students’ Concentration by 6X”. Image does not include some Chinese characters and #VEC2019.

    So
    the Chinese line under the title is present in the newer version but I
    don’t see any other changes. I did a Google image search and this
    appears often on LinkedIn, but it’s not coming up linked directly to
    another source (so far).

    The images seem to have a “source” credited in the lower right corner.

    Retyped here with kept capitalization but not formatting:

    Study on the Effect of VR on Students Concentration, Saga University, Japan, N = 30, Age (12~13).

    Capitalization
    matters because it can indicate how much the author is following a
    particular reference style (APA, MLA, IEEE, etc.) Also some statistical
    and mathematical symbols change meaning if they are capitalized or not.

    So six times the improvement of concentration on VR!  That is an attention grabbing number!

    I’m not the first person to report that FINDING that article by that name or some derivative appears to be impossible. However, looking at that citation, a few thoughts pop up:

    • There
      is a formatting change in the line that looks like text has been added
      or overlaid. In particular, the age information is odd.  Researchers
      don’t usually add the sample groups’ age in a citation particularly when
      everyone in the research study (supposedly) was of the same age.  Ages
      didn’t vary within the study.  The N info can be properly included in a
      figure caption, which is different from a citation. So this info looks
      like a blend of an attempt to give a citation and more information…for
      perhaps “people who were asking”? (I BET.)
    • It is entirely
      possible that this source was published in a language other than
      English. The title is academic-looking but academics are also sticklers
      for choosing the exact words to reflect what we mean and this title is
      actually a little wordy.  That tips me off that it might be a
      translation.  For example, tight academic English would have been “The
      effect of VR on students’ concentration.”  All through some of the
      sources I go through next, I have the feeling that I’m dealing with a
      good-hearted translation.  Good intentions, yes, but not the original
      author’s thoughts. Hmm.


    In 2020, a few other images and a link circulated associated with this research.

    Shared on Facebook as “slides” from a conference talk:
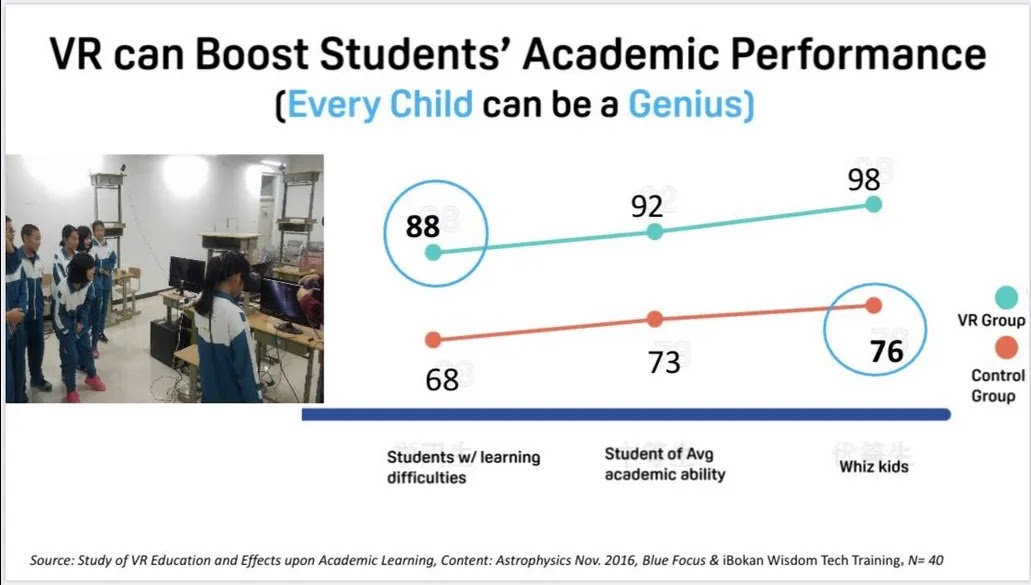
    Take note of the learner’s clothing and the Source.


    This version has the “6X” in big red font with an arrow.

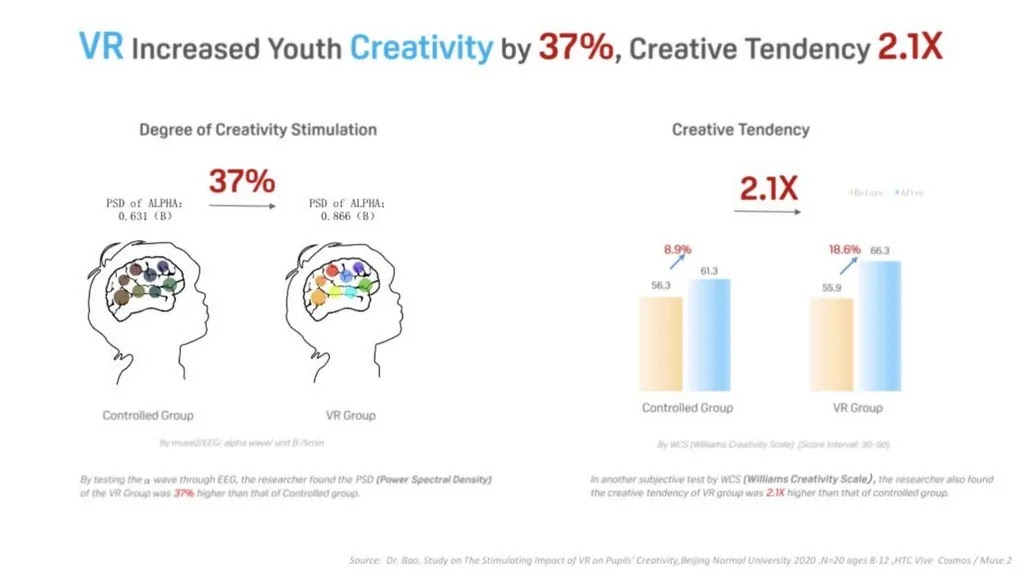
    “VR Increased Youth Creativity by 37%, Creative Tendency 2.1X”

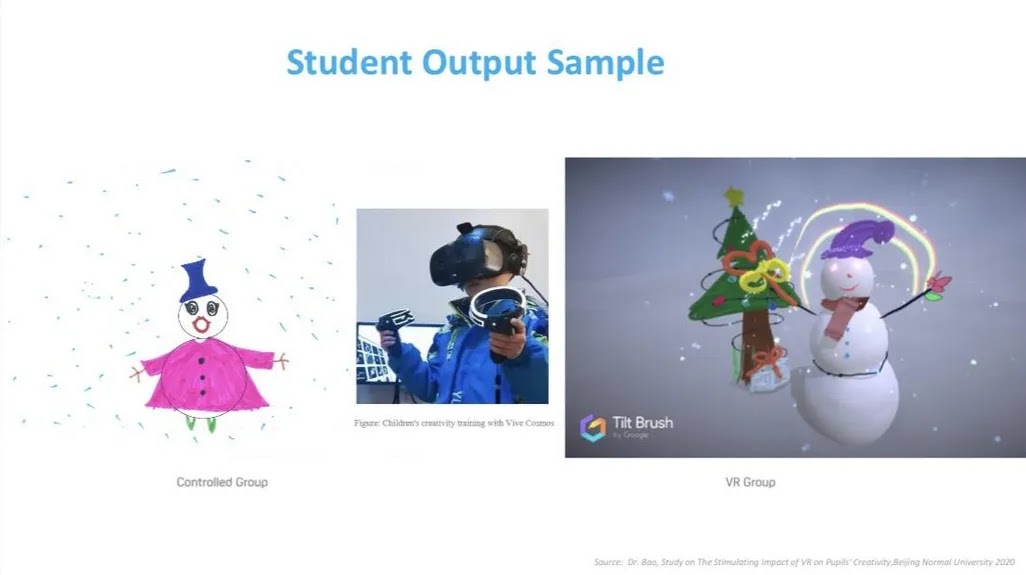
    “Student Output Sample” Personal comment: I find this comparison disgusting, laughable, and then disgusting again.

    There was a suggestion that THIS is the actual study here: A Case Study – The Impact of VR on Academic Performance

    https://mk0uploadvrcom4bcwhj.kinstacdn.com/wp-content/uploads/2016/11/A-Case-Study-The-Impact-of-VR-on-Academic-Performance_20161125.pdf

    For the next part of this article, I’m really getting in the weeds of the research.  Get a cup of coffee and keep up.

    As
    a summary of the research a teacher separated students into a control
    group and a VR group. Then each of those groups was measured for
    learning either in the same class period or two weeks later.  The VR
    group was compared to the control group.

    Note that the control group is the “Traditional” is a teacher talking with a PowerPoint for 30 minutes.

    Remember that Intermediate refers to the ‘same day’ test and Retention refers to the test 2 weeks later.

    Before I get into some problems, I’d like to say a couple of items in this teacher’s defense:

    • First, it is clear that the teacher means well and is supportive about the use of VR in the classroom.  
    • Second, the teacher taught an astrophysics lesson. Physics content is an area of ideal use for VR because
      of the conceptual and sometimes “hard to see” type of content (hard to
      see atoms, hard to conceive of galaxies, etc.). There is always a direct
      relationship between “seeing” and understanding when trying to use VR.
    • Technically,
      self-publishing isn’t awful.  I do that myself. I think more publishing
      will be self-publishing in the future.  But I’m also NOT SELLING
      SOMETHING and not dangling the data behind paid links (cough, Medium) or
      concealing references to support eye-popping results.  Don’t forget, it
      said SIX TIMES.

    Inside this paper, there are some concerning misfires.

    The
    first would be the experiment design.  It is poor ground to stand on to
    compare not cognitively equivalent experiences.  PowerPoint versus VR
    is not a fair fight and just with that item, that research shouldn’t be
    published.

    Second, as I read through to get my bearings, the
    author seems to put some of the wrong data in the wrong places through
    the paper (they talk about the Intermediate data last and the Retention
    data first when those were administered in the opposite order) and then
    they attribute the averages backwards. It’s like the paper had a cut
    & paste festival run through it.

    Example page 9, in a section talking about the Intermediate test, subtitled “VR Improves Test Scores”

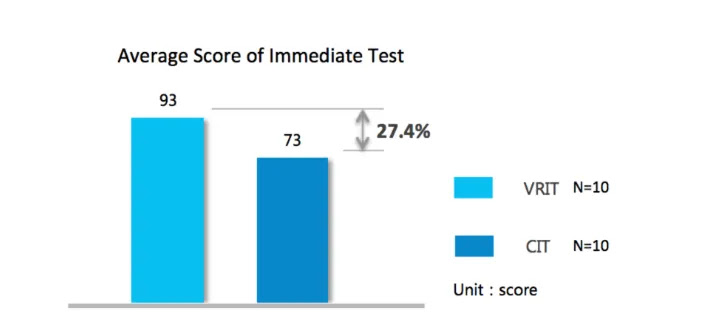
    “The
    average score of the VRIT group is 93, CIT, 73. On average, VRIT group
    has registered a 27.4% growth in terms of score, indicating the great
    advantage of VR in the teaching of astrophysics.”

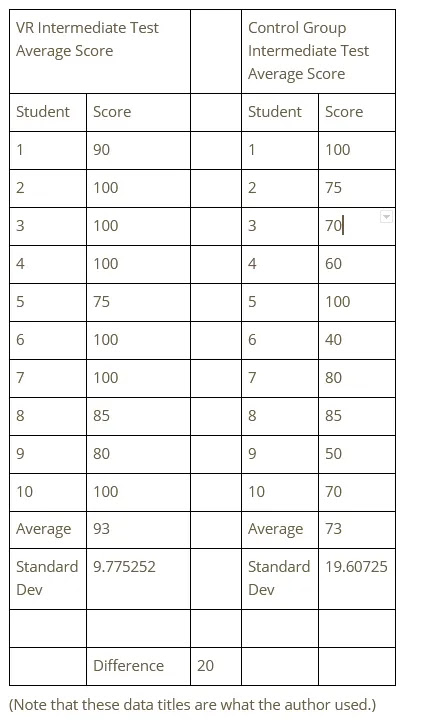
    OK, that first sentence is true.  Here’s my data check:

    I also get averages 93 and 73.  But the difference between 93 and 73 is 20, not 27.4.

    Then on page 10, there is a graph that immediately followed this text: 

    Both
    the text here and the graph indicated that the gap between 93 and 73 is
    27.4%.  It is not. It is 20.  But I’m trained to look for “accuracy”
    that suddenly arrives that wasn’t present before.  Where did that 0.4
    accuracy come from?. And how did the percent symbol sneak in? The
    percent symbol isn’t anywhere else in this image (red flag). Does that
    27.4% look pasted on?  Why? I’d cry “Significant Figures!” here but the
    27. 4% does show up on Page 14:


    “4.2.1. VR Improves knowledge Retention 

    In
    Retention Test, the average score of VR group is 90, while that of the
    traditional teaching group is 68. The gap between the two average scores
    is 32.4%, higher than that in the Immediate Test 27.4% (# 4.1.1-1),
    suggesting that knowledge taught in traditional mode is more inclined to
    be forgotten, while VR-based teaching could help students get a deeper
    impression and maintain long-term memory because it creates a quosi-real
    environment, interacts with students and make students more involved in
    the teaching.” [spelling in context

    OK, so now the text says that the difference between 90 and 68 , which is 22 points, is 32.4%!
    OK, so they are not trying to communicate the point difference (a
    number), they are communicating, on purpose, a percent difference. Ah! 
    OK. Points and percentages are different, and they know that. Now I feel
    better.

    But notice, why would you convert one set of numbers like this:

    • Hey the difference was 20 points!

    To another set of numbers like this:

    • Hey the difference was 27.4%!

    Answer:
    27.4 is interpreted as “bigger” than 20 even though, in this case, they
    are the same (percentage and points, respectively).  Sigh. It’ another
    instance of the SIX TIMES difference.  If I make the number appear more
    impressive, I have more of your attention.

    Folks, this is exactly
    what peeves me here.  Remember that I WANT this research to be positive
    and true.  But when you manipulate the numbers just to get me to go wow,
    I’m on to you. I get extra angry when you are making money off of this
    manipulation.

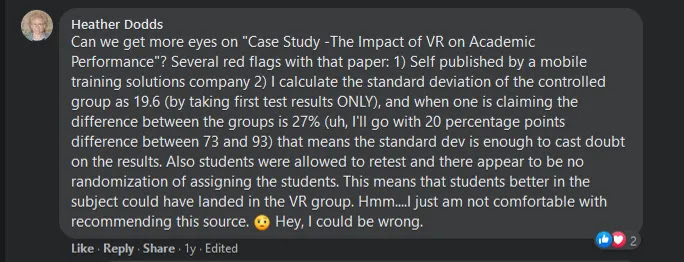
    In 2020, I commented:

    “Can we get more eyes on “Case Study – The Impact of VR on Academic Performance”  Several red flags with that paper:

    1) Self-published by a mobile training solutions company.

    2)
    I calculate the standard deviation of the controlled group as 19.6 (by
    taking the first test results ONLY) and when one is claiming the
    difference between the groups is 27% (uh, I’ll go with 20 percentage
    points difference between 73 and 93) that means the standard deviation
    is enough to cast doubt on the results. 

    Also students were
    allowed to retest and there appear to be no randomization of assigning
    the students. This means that students better in the subject could have
    landed in the VR group.  

    Hmm….I am just not comfortable with recommending this source. Hey, I could be wrong.”


    I
    want to spend just a little more time on the stats.  First, standard
    deviation.  Refresher!  Standard deviation is a descriptive number that
    describes how well the average describes the group.  Quick example:


    One
    class: 2 students. Students score 45 and 55 on an exam. The average is
    50. The standard deviation is 5.  That means that a random student, if I
    could mix all the students up and just pick one student out, differs
    from the average score by 5 points.  Said another way: most students are
    scoring with 5 points of 50. And this is true. In one case, if I picked
    out a student, they’d be scoring 45, which is 5 points off the average.
    In another case, the student would be scoring 55, which is 5 points off
    the average. Five points off and five points off. That’s good, that’s
    ‘tight”. Therefore the average of “50” is a nice tight description of
    how the class is scoring.

    One class: 2 students. Students score 0
    and 100 on an exam. The average is 50. The standard deviation is 50. 
    That means that a random student differs from the average by 50 points.  
    Said another way: most students are nowhere near the average score. 
    They are missing it hugely. Both students are off by 50 points.  The
    average of “50” does NOT describe this class scores very well at all. 
    It’s junk.

    So you generally want small standard deviation numbers if you want to believe that your average number is a good descriptor.

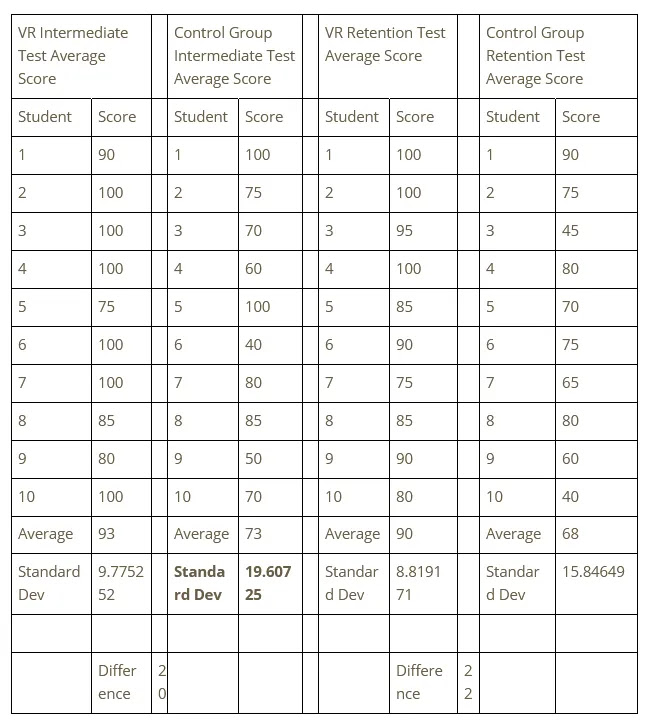
    Let’s go look at those standard deviations (I calculated) again.

    So
    I calculated the standard deviation in 2020 of the Control Group
    Intermediate Test Average Score to be 19.6. Same result by recalculating
    that in 2021 (so I’m using myself as my own data checker by inserting
    time between the 2 calculations).

    That is troublesome.  A standard
    dev of 19.6 when the difference between the 2 groups was 20 means that
    the control group could, reasonably, waver from ~53 to ~93 on their
    score and still be considered “OK” and reasonably near the group
    average.  But that means that the control **could have scored** near the
    VR group.  93 is quite near 93. (#fact)

    So, a statistical flag on
    that play.  When you have reason to think that your experimental group
    and control group **could have* scored the same, you do not have reason
    to think that cause and effect has happened in your experiment, you
    should doubt that your independent variable caused your dependent
    variable’s results.

    In plain language, VR could not be causing higher scores.  Higher scores could have happened by chance.

    This
    is what I meant when I said that this data does hint that “students
    good at VR” could have simply been sorted into the VR group
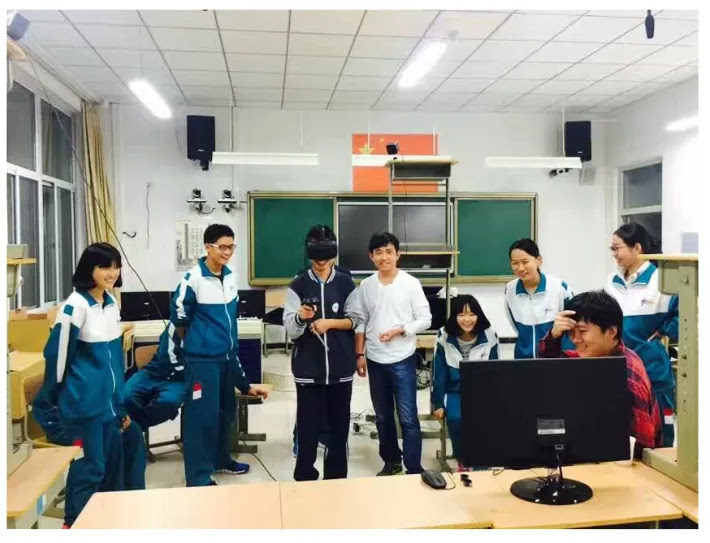
    unintentionally and thus, voila, do great at the content. (The photos of
    the students admittedly look like they are ‘having a good time.’)
    Statistics is meant to help us  know how much to believe in some numbers
    and doubt other numbers. (Remember the line: Lies, Damn Lies, and
    Statistics?) I know this is deep math for some, but it’s just saying
    that these numbers are not believable as they stand.

    Also, I want
    to point out that I’m NOT strong in “power” talk in stats, but this is
    the field of being able to know how many individual data points you need
    before you can trust a whole set of data points. Data points are known
    as “N”s.  An N of 10 is quite ridiculously low for a sample size.  10
    students are nice but no one should be spending thousands of dollars
    buying headsets or software because of data from 10 students.  And
    remember, when you are seeing these numbers, you are being convinced to
    buy.  You are NOT being convinced to research deeper. More on this is
    coming after some more scrolling down.

    Finally, one last big item that you might have forgotten down in these weeds:

    After all that searching, where is the EEG data?

    Where’s the EEG data?

    Well,
    not in this paper, that’s for sure.  But the image you are looking at
    has only ONLY half-hearted reference on it (lower right).  Where does
    the EEG data come from?  I tried to find it both by topic and image
    search.  Maybe that’s where “Saga University” comes in?  I don’t know.
    Word on the street is that that EEG data is made up.  I really don’t
    know. I can tell you that I’m suspicious because I’m not sure why one
    would research on VR with EEG (a reasonably expensive test), publish
    your results in color, find six times more activity and then bury your
    published paper about it?  Seems fishy to me.  Again, though, this could
    have happened all in another language and me and Google are failing to
    find it.

    There’s possible other stats problems in the paper but I’ll let it rest.

    Also
    circulating from 2020 was this one long infographic that I screen
    captured into slices.  The images are grainy, I know. (sad face)
    Presentation slide: “VR-based Education Shown to Enhance Academic Performance, November 2016”

    Slide from presentation.

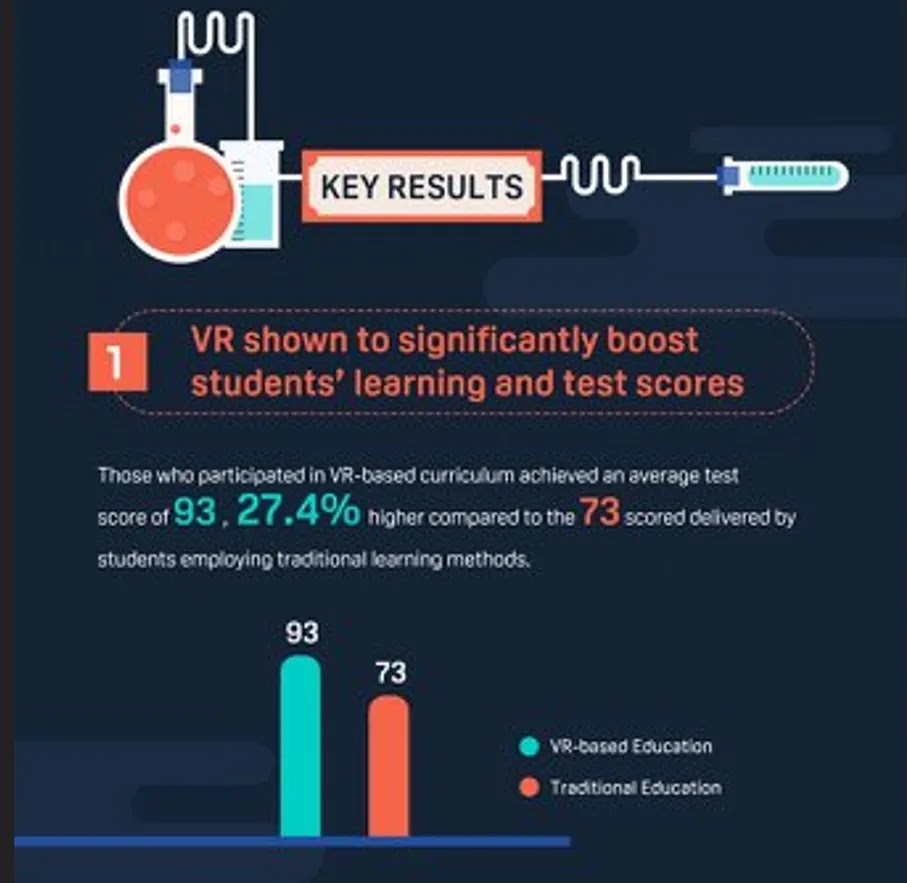
    Slide from presentation with text “VR shown to significantly boost students’ learning and test scores”
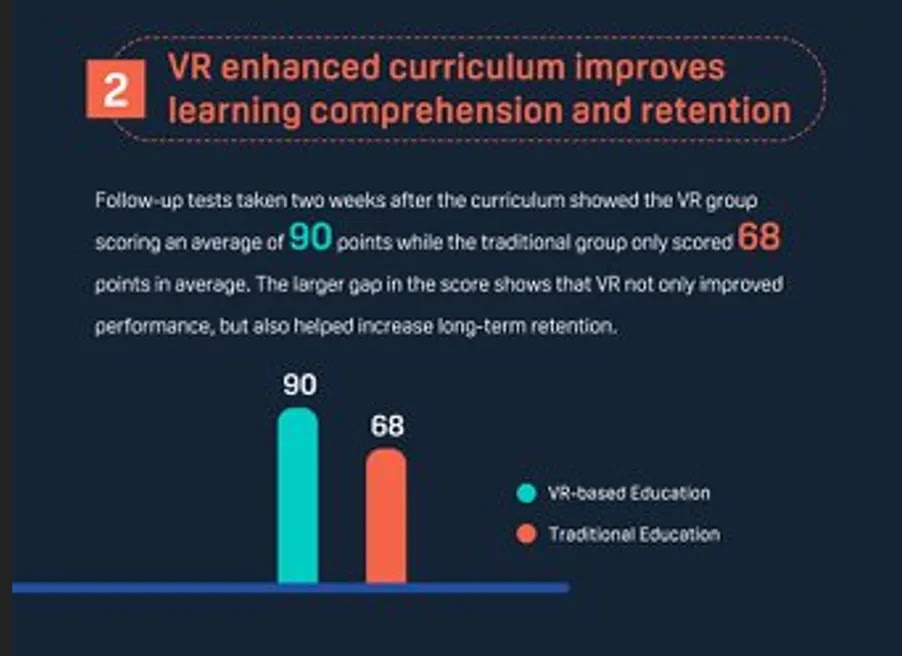
    Slide from presentation with text: VR enhanced curriculum improves learning comprehension and retention

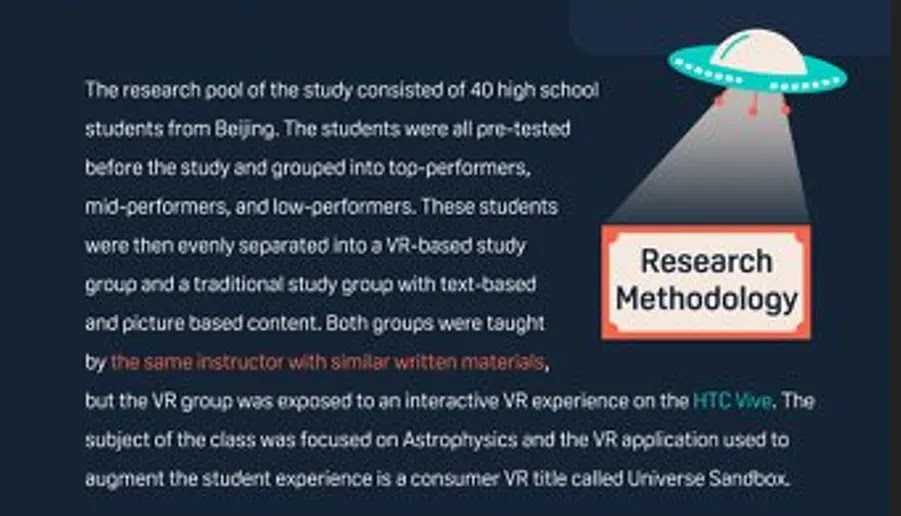
    Slide from presentation emphasizing that the control and experimental groups had the same instructor

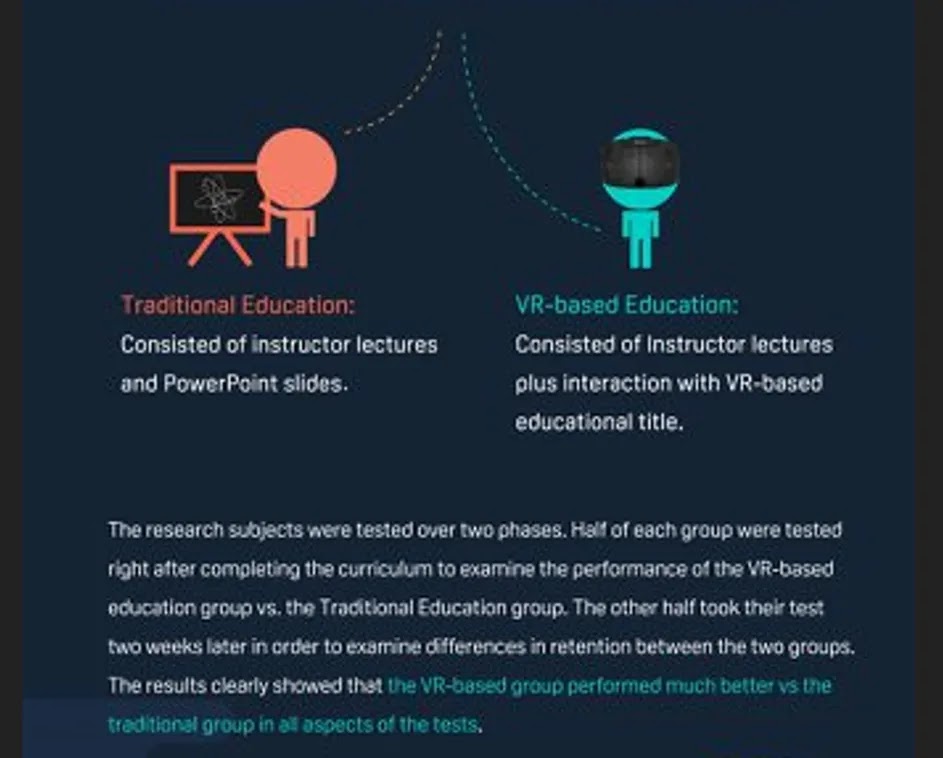
    Slide from presentation emphasizing that the VR was additional to the traditional instruction.

    Slide from presentation with QR code. Note prominent VIVE logo.

    This
    infographic appears to be supporting this image. The “Every child can
    be a genius” phrase and the numbers appear to be the same.  I have only
    one item to say about these slides: cute UFO theme.

    Note that the student clothes looks similar:


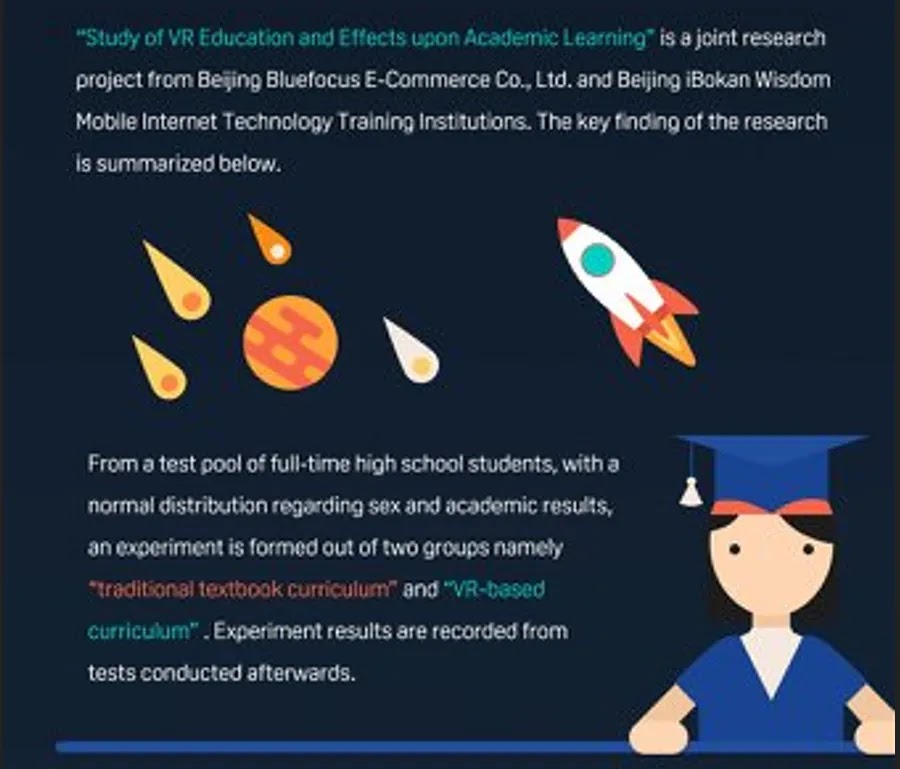
    I tried to find “Study of VR Education and Effects upon Academic Learning”  Google Scholar and Google can’t seem to find it.

    Searching on iBokan Wisdom Tech Training instead, it seems to be used as a reference from here: https://www.degruyter.com/document/doi/10.1515/phys-2017-0114/html

    To: here:

    [5]
    Beijing Bluefocus E-Commerce Co., Ltd. and Beijing iBokan Wisdom Mobile
    Internet Technology Training Institutions, A Case Study – The Impact of
    VR on Academic Performance, 2016. Search in Google Scholar

    That is a dead end, as in, dead link:


    Back
    to the August 2021 comments.  Notice how even if this data cannot be
    substantiated, folks are still eating it up! 99 reactions last I
    checked:

    Who needs sources?


    (Blocking all these names is making me crazy!)

    Or at least, they are eating it up if they work at that same company as Author A.


    But there are a few of us VR Research Jedi’s prowling that send up warnings.  


    My
    colleague is much more even in tone than I am but they do strike the
    right balance with saying that we ARE hoping to find positive learning
    research as it relates to VR.  

    But this isn’t it.

    P.S. I don’t know why Author A posted twice.  Zealous much?

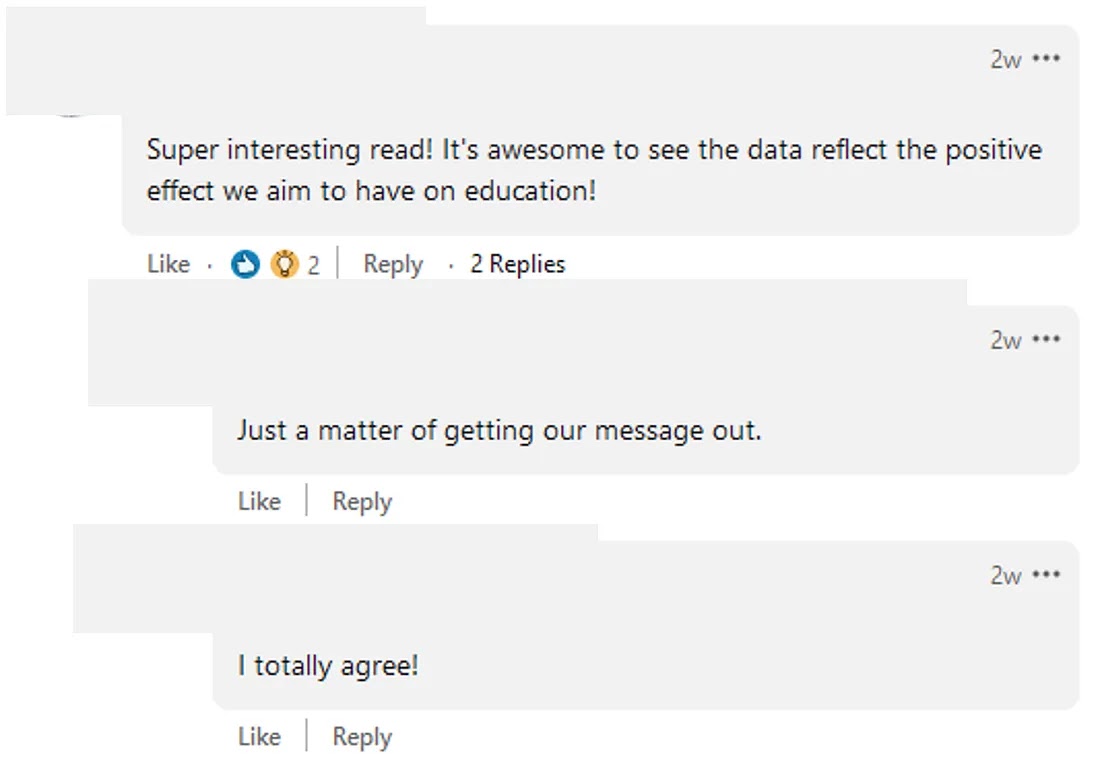
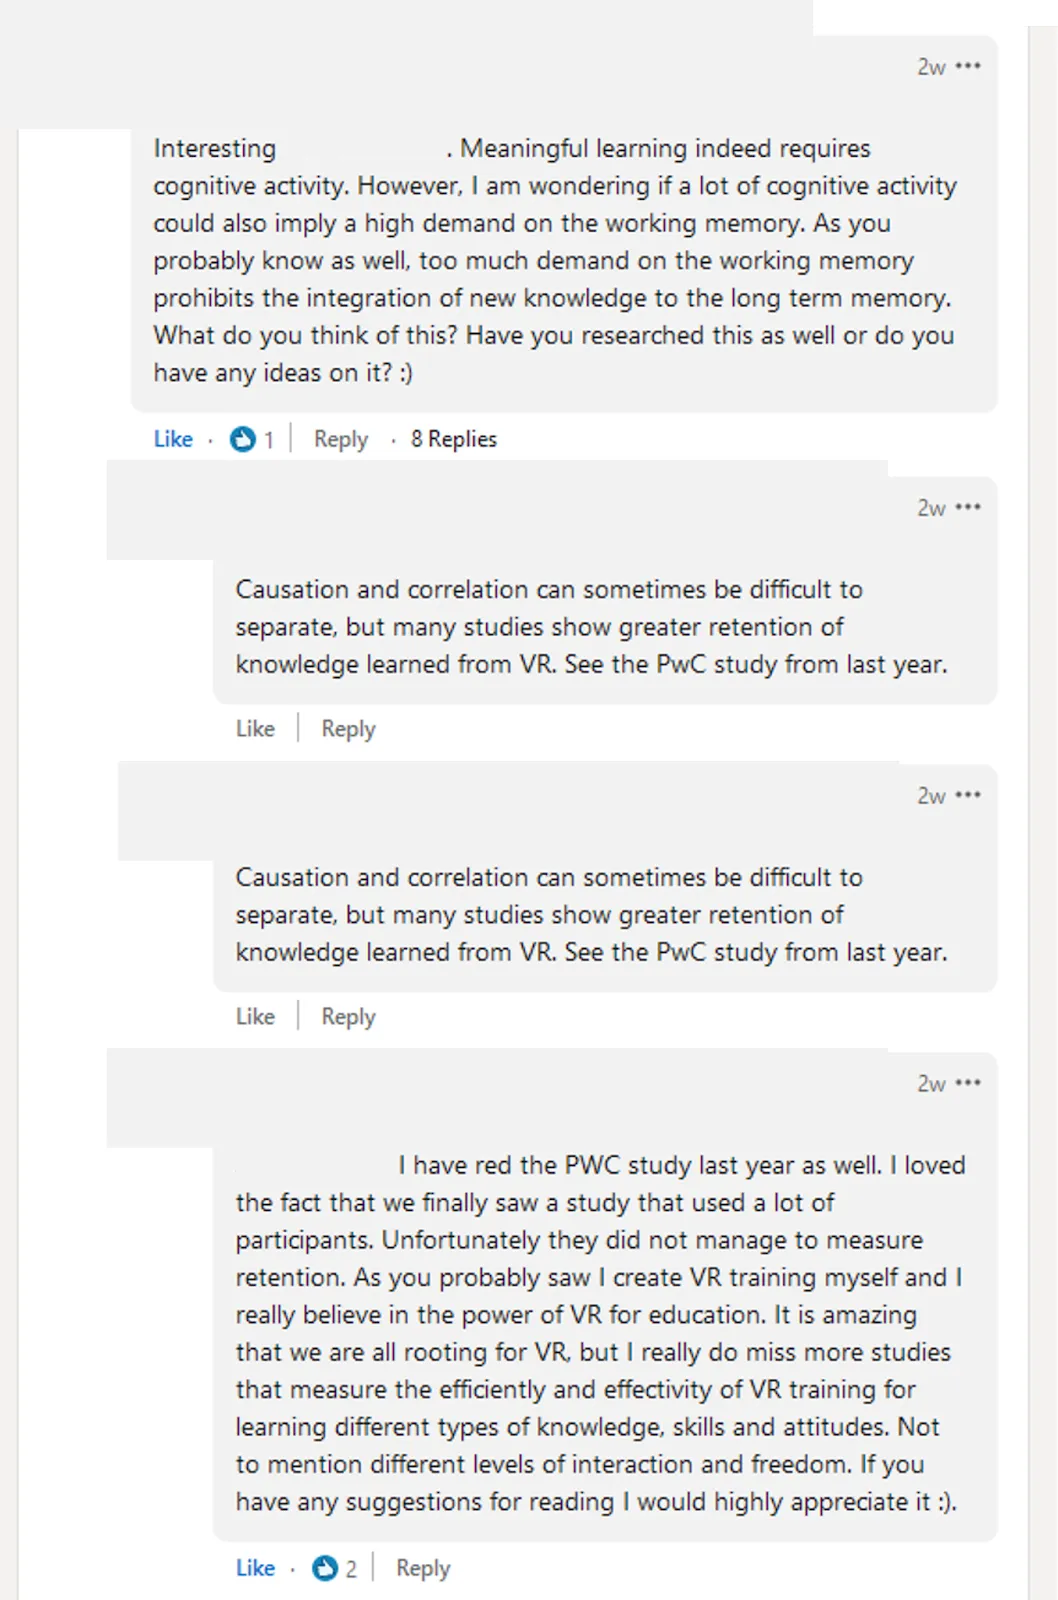
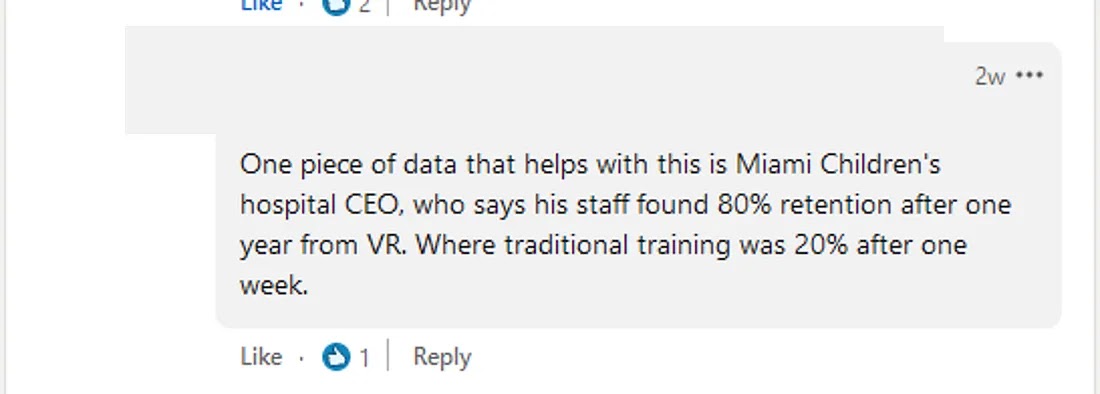
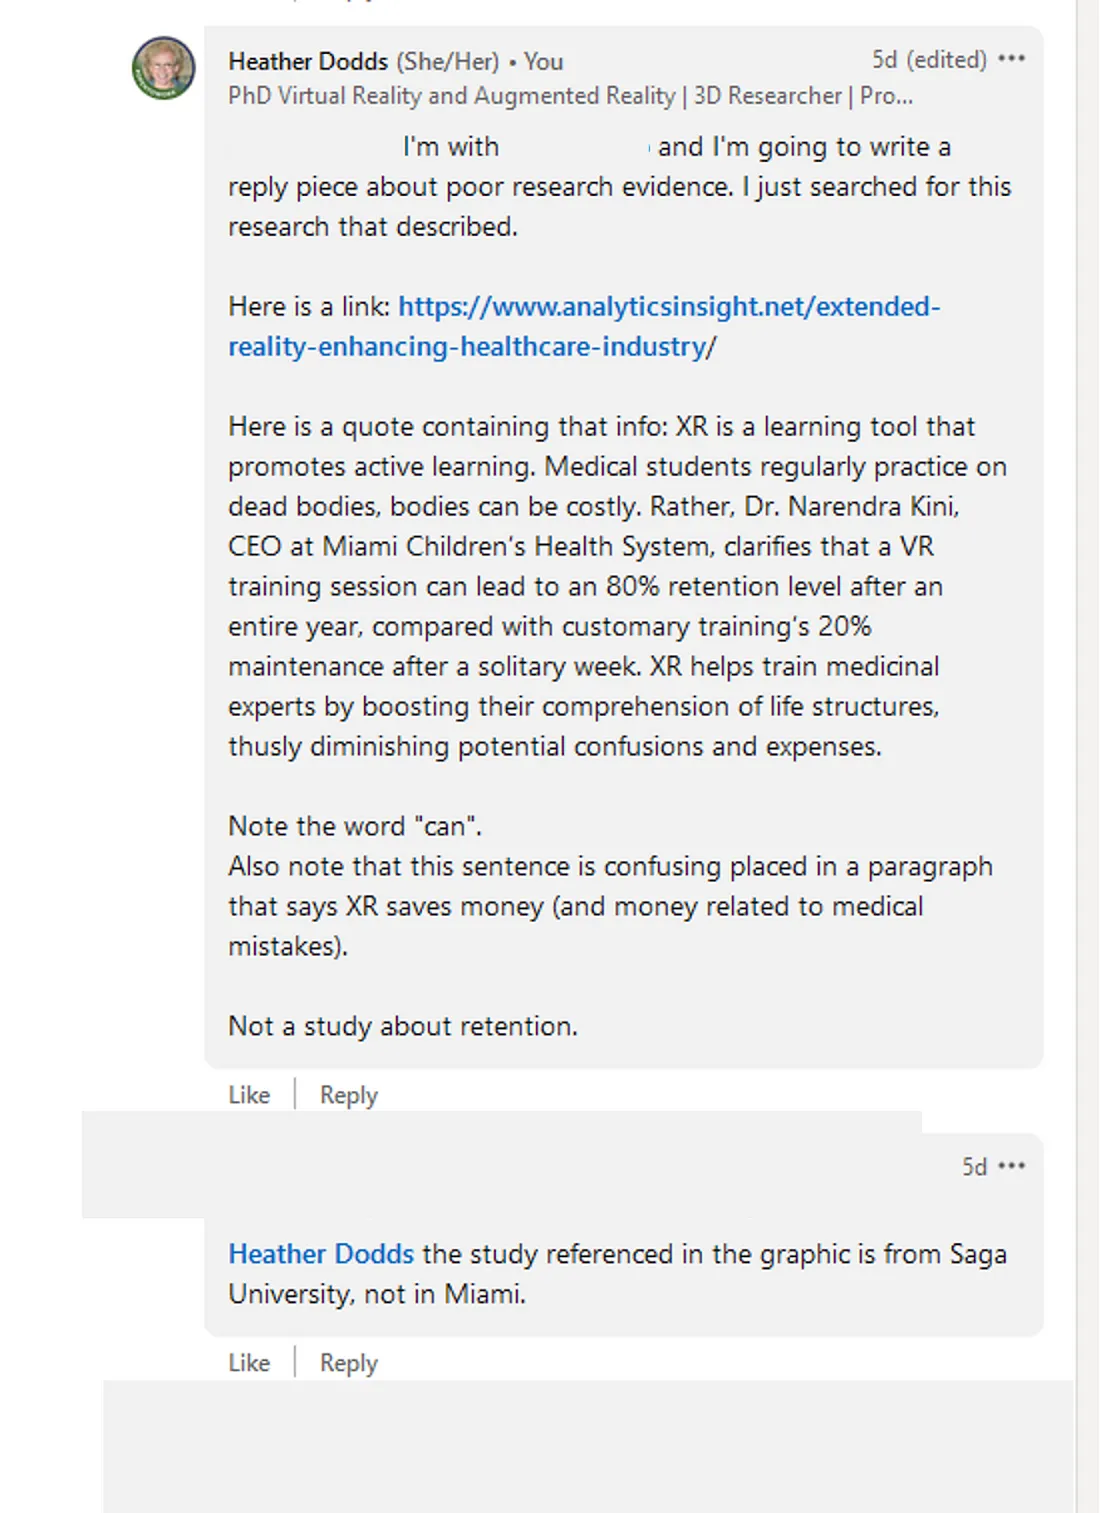
    I’m coming in here.  This is the link I share: https://www.analyticsinsight.net/extended-reality-enhancing-healthcare-industry/


    Uh. 
    I didn’t respond after this.  Author A apparently didn’t realize that I
    was questioning the research in HIS OWN reply immediately above about
    the “Miami Children’s Hospital CEO”.  Perhaps he thought I was so
    excited about his first graphic.

    If you cannot properly mansplain to me, I just don’t know what else to say.


    Note:
    side fight broke out! Although, I’m not sure what they are fighting
    about…  I suspect autocorrect did it because that’s one perky
    disagreement.  Tee hee hee…


    There
    is one honorable mention of a person that asked for “we need a
    concerted effort to also communicate the methodology and external
    validity for such research. For industry adoption, particularly
    healthcare, the core elements of research must be extracted and
    communicated alongside the highlights”

    Hey, nice try buddy!


    Note that all of the positive supportive comments came from people working in the VR industry.  That’s not bad, it should just be noted.

    If you are selling me something, don’t I have a right to doubt the research you hand me?


    FYI,
    during the writing of this article, this same Author A continues with
    the “I’ll tell you something tantalizing about VR!” and then makes you
    click on a link where:

    He makes money.

    He doesn’t have to give you more information or sources.


    That LinkedIn link right there? Goes to Medium, for a “2 minute” article. I didn’t click on this.

    Why does all of this matter?

    Because
    media will never influence learning.  Yup. I’m a Clarkist.  Studies
    that say that VR makes eye-popping differences in learning is not
    supported by every media study we’ve ever done as humanity since the beginning of time.  

    If
    we go around telling everyone that all students will be geniuses and
    that VR will cause six fold increase in grades, those of us that DO
    support VR for education are going to be out of jobs pretty quickly as
    that bubble will pop.

    ~~

    I recently watched Exodus: Gods and
    Kings and I love this exchange between Moses and Malak (who is the
    messenger of God).  Moses is fed up with Egypt/slavery and is being told
    to cool his jets by God.

    Moses: So what do I do, nothing?

    Malak/God: For now, you can watch.

    ~~

    You can watch. 

    You can watch as I tear this research up.


    Clark, R.E. Media will never influence learning. ETR&D 42, 21–29 (1994). https://doi.org/10.1007/BF02299088

    #edtech #research #VR #VReducation #VRResearch #TooGoodToBeTrue #MediaWillNeverInfluenceLearning #InstructionalDesign


    This is a copy of the article I published on Linked In on August 17, 2021

    This post was edited on April 11, 2026. The font was improved and the images re-placed. Slight editing of content.
  • Virtual Reality for Soft Skills…Maybe

    Virtual Reality for Soft Skills…Maybe


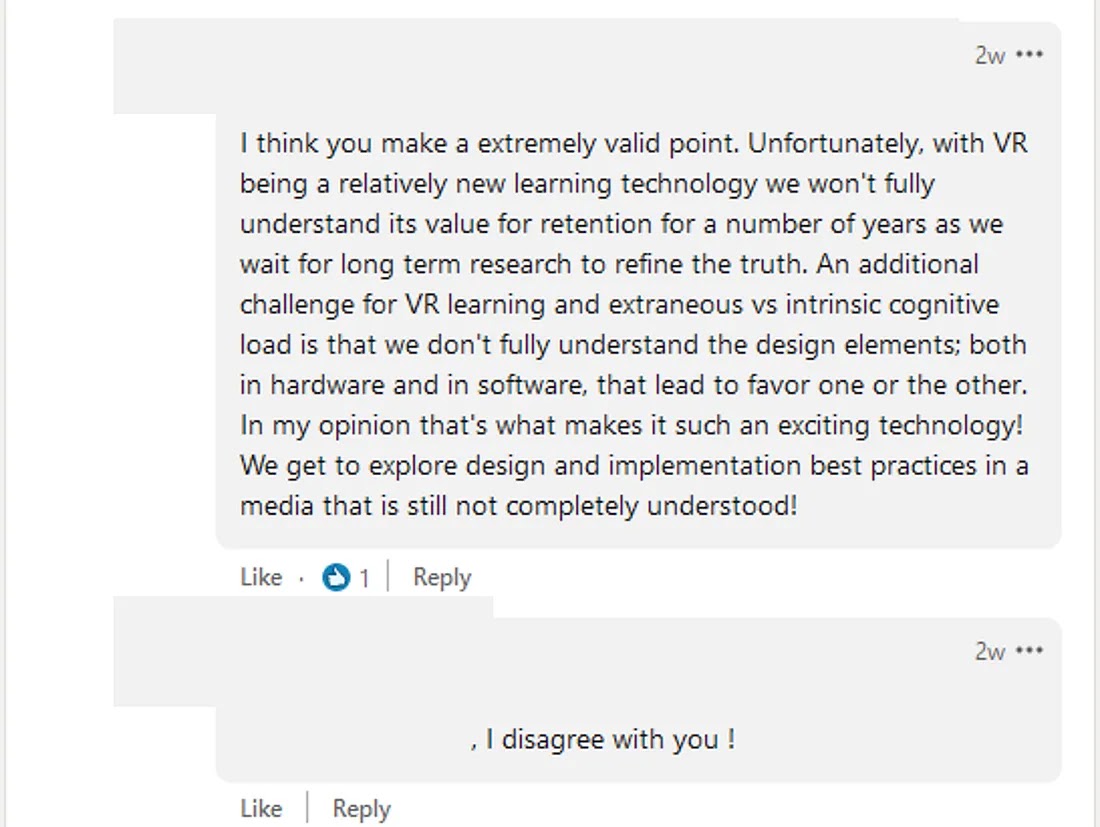
    There you are, eating your morning bowl of cereal. You glance at your social media feed. Up pops these images:


    Screen captures of infographics and images made from the 2020 PwC VR for Soft Skills Training Report. In the lower right hand corner, a person is wearing a headset and looking amazed.

    Wow. Even the infographic people seem amazed.

    But
    if it is too good to be true, it probably is, at least where research
    and marketing intersect. Not to worry! I’m here to tear apart this and
    see what’s inside. Can virtual reality (VR) teach soft skills training?
    Verdict: Maybe.

    My Executive Summary:


    Heather's summary of the PwC analysis:  2 results are garbage (confidence and focus) 1 result is just okay (faster), 1 result in good (more effective) and 1 result was buried, than the learning had no significant difference.

    Let’s start with the nuts and bolts.

    Citation & Report

    Mower,
    Andrea. “The effectiveness of virtual reality soft skills training in
    the enterprise: a study”. [Place of publication not identified]:
    PricewaterhouseCoopers, 2020. Online. Internet. 21 Aug 2021. .
    Available: https://www.pwc.com/us/vlearning.

    Despite that
    academic-y looking citation, the writing does profess itself to be a
    report, not research. That’s good because reports are not held to the
    same standards of rigor as research.

    What you find at that web
    link, however, is NOT the full report. You are looking at the corporate
    summary. Remember that technically, PwC is not in the VR business (a
    plus) so they are not selling you something about VR. They are only telling about how some VR training went at their company.

    Something
    quoted the report as “73 pages” but the website is not 73 pages long,
    so I had to find the actual report. That took a little more digging but I
    found it here: https://www.5discovery.com/wp-content/uploads/2020/09/pwc-understanding-the-effectiveness-of-soft-skills-training-in-the-enterprise-a-study.pdf

    Experimental Design

    Disclosure is right up front (first sentence!) that:

    “supported by Oculus for Business and Talespin,”

    Good
    disclosure; it’s good practice. While I’m not loving that it is
    sponsored by a VR headset manufacturer and training creator, knowing
    this lets me view this with the appropriate amount of critical thinking.

    Their study started in 2019 and ended in February 2020, so they indicated when it was run.

    Note:
    Every piece of research that touches 2020 and forward into the near
    pandemic future, should clearly mention WHEN the study was run, because
    the COVID pandemic is impacting every part of our lives.  COVID does impact “reports” and we need to know if these are ‘at-home-stressed-but-sent-a-headset’ users.

    They had a hypothesis: Our
    hypothesis was that training using VR is more effective in achieving
    learning outcomes than traditional training methods (classroom or non-VR
    digital experiences).

    Remember that a
    hypothesis in experiments is good. Hypotheses guide us to our data and
    results. Bias in experiments is bad. Bias makes us ignore our data and
    results.

    And PwC defined “more effective”  with:

    • Employee satisfaction
    • Learner flexibility
    • Comfortable learning environment
    • Improved attention
    • Higher information retention
    • Confidence building

    That definition of “more effective” is a little murky. Usually time plays a very definitive role in “effective” measurements. For example: widgets produced over time. Here, time is not actually mentioned and yet time is prominent in the infographic stats later. Hmm..

    In their experimental design, PwC appears to think that they have made comparable training: 

    • classroom,
    • e-learn,
    • v-learn (VR).

    Oo, bust here.  While I hat tip to the innovative thought process expressed here, to take advantage of what VR can offer…

    “The
    classroom and e-learn course experiences were linear: A video was
    shown, the learners asked some questions, then the next scenario was
    presented.”

    “However, we determined this linear approach would not
    leverage any advantages of the VR modality. We hypothesized that
    placing the learner directly in the scenarios covered in the curriculum
    and giving them the ability to act as they might in real life would be
    more rewarding for them.” (p. 16)

    … but, owch, non-comparable methods!!  If you literally taught the information differently, you cannot compare the methods and thus, you cannot compare the results
    The key to making a good design that includes VR (and I’m giving you
    the $64,000 answer here for anyone designing “compare” research with VR)
    is to put it up against something very, very cognitively similar. 
    Right now, that technology is 360 video where you put in branching
    decisions. And add haptic bodysuits & controllers. But that convo
    is for another day.

    Now to parse out the difference between 360
    video and VR, you’ll need thousands of users. Not many investors right
    now have the willingness to spend thousands of dollars in equipment and
    time to collect that much data.  And even when you get there, you
    probably won’t find much a of difference. Why? Well, take a look at what
    you designed.  If you make a cognitively similar experience and run
    humans through it, it actually makes sense that no significant difference in the data will arise. 
    Remember at this point, I’m talking about learning outcomes ONLY, no
    other characteristic. Also, go back and look at the hypothesis. They
    already thought that the ‘learning outcomes’ would be the same (READ:
    same scores on tests) but that they could achieve those learning
    outcomes “more effectively”. That’s interesting. I wonder how much of
    this report was written from hindsight and how much was written before
    the study started. (This is why you write your hypothesis first–before
    your study.) That hypothesis is now possibly showing a bias…did they
    *think* it was going to turn out…the way it did?

    Number of participants: 1600 possible. Good. But they never disclose how many learners they actually had in each group (their Ns).
    Therefore, I’m going to call this a strong negative because they could
    have included that number (I don’t see a business reason to conceal
    it).

    Experiences: 5-7 minutes long

    Did use Oculus Quest (ahem)

    Did use Oculus for Business for remote device management

    Honorable
    mention in the report: Using the phrase “not the most gratifying” when
    talking about tagging and inventorying what must have been more than 300
    pieces of equipment.

    One more small note: The report does a nice
    job explaining how they decided to buy 100 headsets and what the cost
    and time of developing the v-learning training was. It is outside of my
    scope to analyze that but I will recommend it as good to read. Remember
    that if the cost of v-learn is dropping, it becomes a better and better
    choice over time. They do those calculations and find that it becomes
    the better choice at 3,000 users/learners.

    Let’s see what the data shows:

    Screen capture of the 4 key metrics that were made into the infographic, claiming that VR is: 4x faster to train than the classroom, 275% more confident than the classroom learners,  3.75x more emotionally connected than classroom learners, and 4x more focused than their peers.

    4x faster to train than in the classroom

    I
    might have to cede this one right off the bat because VR does provide a
    1:1 experience that most classrooms cannot beat. How many classrooms
    can provide– minute for minute– the same 1:1 attention of the teacher
    to the student? Erps. Few.

    Fly in ointment? VR can cost a great deal of money for development and for the equipment. READ: the set up.

    Counter to that?
    VR can be done for very little money and because training can be
    replicated a billion times when a 1:1 teacher cannot be replicated, VR
    wins the day on this claim.  READ: it CAN save time but after
    development is done.

    I still don’t like comparing “classroom” to VR, such a not-fair comparison.

     “What
    took two hours to learn in the classroom could possibly be learned in
    only 30 minutes using VR. When you account for extra time needed for
    first-time learners to review, be fitted for and be taught to use the VR
    headset, V-learners still complete training three times faster than
    classroom learners. And that figure only accounts for the time actually
    spent in the classroom, not the additional time required to travel to
    the classroom itself.”  

    In the report, they shared numbers in minutes. 

    Classroom:
    2 hours (Watch that crossfire, boys! They didn’t express this as 120
    minutes. Heather gives PwC a strong look for that. Don’t be mean. Or
    get a better editor.)

    E-learn: 45 minutes

    V-learn: 29 minutes

    29 * 4 = 116

    116 is close to 120. Therefore, saying V-learn is 4 times faster is accurate. [Edit: In future writing, I clarify that stating “4 times” or “4x” is not a data lie, but it expressing a truth in a deceptive way. Learners didn’t learn four times faster, the literal training session was 1/4 as long in time. So they sat through LESS training time. That doesn’t mean that they learned faster.}

    275% more confident to apply skills learned after training

    This is a poor item to measure when we are focusing on learning outcomes.  The Dunning-Kruger effect says that those least able to accurately self-measure something are actually the worst at that thing.

    They
    make an argument that particularly with soft skills, confidence AFTER
    training would help implement the soft skills in the workplace. I liked
    their design inside the V-learn module. Learners had to say their lines in the simulation. Nice touch!

    But alas, this is all future prognostication and not actual data. We can hope for something but that doesn’t mean that our hope leads to actual results.

    Screen capture of graph from report showing all numbers higher than 100% for confidence, but we can't tell what the percentages are exactly higher than.


    166% and 275% of what?  Where is the 100% in this diagram? Said another way, what is the baseline? Zero?

    I still can’t find this in the report.

    3.75 x more emotionally connected to the content than classroom learners 

    I’m
    not going to pick this one apart much because the errors should be
    apparent.  Often VR presents training as first person– meaning the user
    looking through the headset is often the protagonist of the adventure.
    Therefore, a story happening personally to the user creates more emotional connection than the same story in a classroom. This comes from the bucket labelled obvious
    and is frivolous data.  It also blatantly shows what’s wrong with using
    non-comparable instructional designs.  This is an apples to oranges
    comparison.

    FURTHER, newer data is showing that types of empathy count…not just general empathy or emotional connection.

    4x more focused than their e-learning peers

    There
    are some great accessibility studies and autism spectrum studies coming
    out that are showing us some very interesting research (really, it’s a watch this space
    stuff) that VR can be more cognitively overwhelming for some learners
    and hence every measurement that says learners have more brain
    engagement could actually be learners overwhelmed (yeah, obvious bucket
    again).  

    But let’s look at what was actually said here:


    Screen capture of table from report: Focus is on the questions:  How many times were you multitasking or distracted during this experience? and How many minutes do you estimate it took to get back on task?

    “With
    VR learning, users are significantly less distracted. In a VR headset,
    simulations and immersive experiences command the individual’s vision
    and attention. There are no interruptions and no options to multitask.
    In our study, VR-trained employees were up to four times more focused
    during training than their e-learning peers and 1.5 times more focused
    than their classroom colleagues. When learners are immersed in a VR
    experience, they tend to get more out of the training and have better
    outcomes.”

    It doesn’t say how the “more focused” was measured? I
    wonder?  Remember the clue to look closer is when the presentation tends
    to do a ‘hand wave’ approach on something.  It’s equivalent to
    misdirection by a magician.  If you look over here, you are not looking
    over there.  The text says “There are no interruptions and no options to
    multitask”.  Yes, the Oculus Quest headset design doesn’t allow a user
    to look around or to (reasonably) be interrupted by messages from outside of
    the experience.  But did that mean interruptions didn’t happen?  What
    about a “this is pulling my hair” message?  Or “it’s fuzzy” or even “I’m
    gonna puke.”   Those are interruptions caused from the inside out. 
    Were those counted?

    In the report, it looks like self-disclosure:

    Screen capture of Improved attention section of report: 45The Effectiveness of Virtual Reality Soft Skills Training in the EnterpriseAs identified in our key findings, VR-trained learners were up to four times less distracted during training than their e-learning peers and 1.5 times less distracted than their classroom peers. This was self-reported, and the team did not use any passive technology to observe this attribute. Based on experience and months of observation, the team actually felt the self-reported statistic was lower than what we observed. However, the statistic was significant and should result in higher learner comprehension and retention.

    At
    this point in the paper (p. 45), my hackles are going up because you
    cannot see data (self-reported), acknowledge it (we thought it was
    higher), then throw it out (“the statistic was significant and should
    result”??).  What? PwC?  My doubt meter is red-lining at this stage.
    Insert Mr. Potato angry eyes.

    5. VR learning can be more cost-effective at scale

    Interestingly,
    this didn’t make an infographic!! What?? What a shame because right
    here I AGREE with this paper!!!!!!!!!!!! ARGH!~!

    YES, YES, YES. VR
    is more expensive to make once (but that cost is dropping) and it can
    be replicated (which is where you win) but it is also showing
    impressive  results in FLEXIBILITY (meaning, you can change up the
    conditions quickly). VR can be made cheaply, which also means basically,
    but that might not be a bad thing.  Get over the hump of the novelty
    effect and design a basic experience which is accessible to many
    learners and you are in an effective horse race with other forms of
    learning.  What I’m trying to say is that basic and/or cheap isn’t
    necessarily bad in VR.  It should not be thrown out. Because this is
    where VR is going to eventually win.

    They are using their own
    costs and admittedly, the fact that it’s a large study now hurts them
    because that means more money was outlaid to get the training started.  

    Revisiting how many actual participants???
    They said 1600 eligible but they never said how many it was AND then
    they said that they “offered” v-learn to the classroom and e-learn
    participants as an option (and those went on to answer a smilie sheet on
    how much they liked it).

    One Result Buried

    OMG look at this that they tucked into the back of the paper, I didn’t even know it was there!!!!! Page 44.

    Screen capture from Higher Information Retention section of paper: We quickly discovered retention scores were inconclusive, as the delta between pre- and post-assessments in each modality was not significant. Indeed, the assessment team underestimated the previous knowledge experience our test population had on the diversity and inclusion topic. In hindsight, we should have selected a topic that was not already in our curriculum or selected a different test group that had not already been immersed in similar training.
    PwC study conclusion: No significant difference in retention

    No SIGNIFICANT DIFFERENCE in RETENTION!!!!!!!!!!!!!!!!!!!!!!!!!!!!!!!!!!!!!!!!

    I’m
    currently on the floor laughing because that is what research data has
    lead us to predict all along.  No difference.  They’re blaming the
    content in this case. OK, picking myself up off the floor and dusting
    myself off. Insert droll look here. It’s not the content, yo.

    What PwC is missing right here is this: No significant difference results eventually means that the cheaper option to learn the same material will be market dominant. Translation: make VR easier to MAKE and VR will be bought. Cha-ching.

    Final verdict: Mixed Bag

    •2 metrics (confidence, focus) = garbage

    •1 metric (faster) = just okay

    •1 metric (cost effective) = good

    •1 result (no significant difference) = buried

    Conclusions

    • Enough doubt to worry about other PwC infographics

    • Overall, not bad for a “report”

    Not research.

    Can
    VR teach soft skills? It appears so, yes, at least as well as
    classroom and elearn options. (No comment on the quality of the
    instruction or the assessment.) Right now, v-learn is an expensive
    choice. But the price for development IS dropping. I have high hopes.

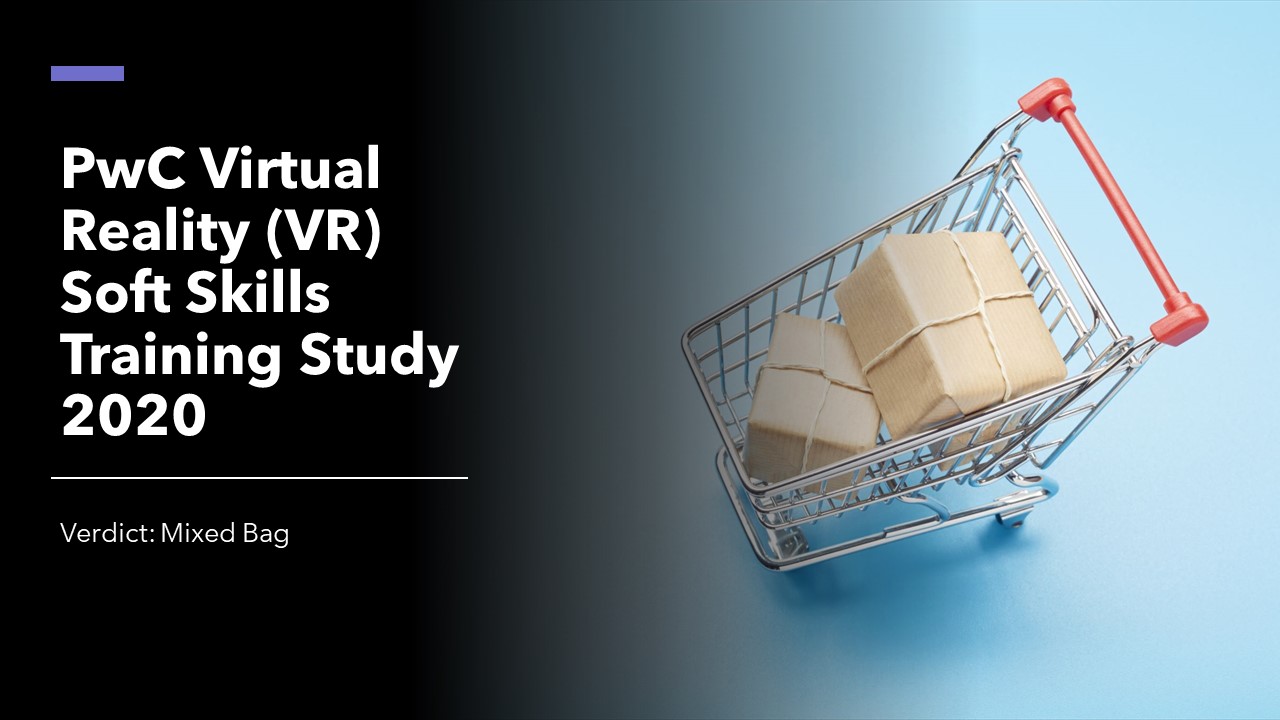
    Title image for article: Analysis of PwC Virtual Reality (VR) Soft Skills Training Study 2020. Verdict: Mixed Bag. Image of shopping cart with various brown boxes.

    This was my 3rd planned article on analyzing research.

    1st article Study Does NOT Show That Instructional Designers Drive Better Student Outcomes.

    2nd article “What Happened When Student Brains — On VR — Were Scanned” Is Analyzed

    This is my 2nd article of three specifically about VR research.

    1st article “What Happened When Student Brains — On VR — Were Scanned” Is Analyzed

    More
    to come in the next few days because the next article is already
    written. That will end, hopefully (!), my series on poor VR &
    learning research. [Edit from the future: The bad research as kept on coming. My “Seeking Integrity” Series refreshes this topic.]

    #Research #VRResearch #VRReport #PwC
    #SoftSkills #Faster #Confidence #Emotion #Focus #NoSignificantDifference
    #OculusQuest #elearn #vlearn #Talespin #NotResearch


    This is a copy of the same article that I posted to LinkedIn on August 25, 2021. This post was slightly edited on April 11, 2026 with an improved font, re-placed banner image, and added link to further writing on this PwC study.

  • Analysis of “Is VR the Future of Employee Training Programs? Bank of America Thinks So”

    Analysis of “Is VR the Future of Employee Training Programs? Bank of America Thinks So”

    Article: Is VR the Future of Employee Training Programs? Bank of America Thinks So

    Published on October 28, 2021 – By Emma Ascott

    Within the article, links to press release,

    Bank of America is First in Industry to Launch Virtual Reality Training Program in Nearly 4,300 Financial Centers

    by Bank of America (BoA) dated October 7, 2021 here: https://newsroom.bankofamerica.com/content/newsroom/press-releases/2021/10/bank-of-america-is-first-in-industry-to-launch-virtual-reality-t.html

    I find 3 errors:

    1. The bolded statements right at the top of the allwork article version allude to “executive summary” or “highlights”. But look at that middle one. Remember, when you do something to get your audience’s attention (97%!), you better deserve it. In this case, BoA really does not.

    2. The general hand-wave effect of statements made throughout are signalling a weak foundation. I worry about this. Who sold what snake oil to which BoA leader for this entire project to proceed.

    3. A lack of needs analysis might have happened, but claiming that a “lack of evidence” is evidence for something is shaky ground. Nonetheless, BoA leaves a few hints. (“We are constantly seeking ways to implement advanced technologies that
    offer better solutions for our teammates and our clients. “)

    Bonus points: the headset are rolling out at 4,300 locations but called “VR”—- which is funny because you could roll out VR at an infinite number of locations with zero headsets (cough WebXR)…but I guess that memo didn’t make it around.

    1. You got my attention, bold bullet

     Immediately one’s hackles are raised by bullet #2.

    •  97% of those who have used VR felt more comfortable performing their tasks after going through the simulations. 

     I mean. really. Here, I fixed it for you:

    •   97% felt more comfortable performing their tasks after going through the training. 


    Don’t you feel bad for that 3%? I worry that they don’t work for BoA anymore (giggle). But statistically, they had 400 employees in their pilot test group so that means 12 employees didn’t “feel more comfortable”. Any bets on vertigo? I’m going with that.
    But hey, let’s pass some kudos to the training department at BoA because 97% of the employees DID feel “more comfortable” performing their tasks after going through the training. So yay! You ARE making an impact. 
    Back to being cynical though, it’s throwing around a number like 97% that just stirs the pot of folks’ angst with math and understanding. I bet that if I took a ‘flash survey’ of readers of this article, I’d get some people who would say “learners that used VR got a 97% on their BoA test”. Yeah, it doesn’t say that at all. 


    2. Hand Wave Statements

    I must credit the “hand wave” phrase to my former colleague Gideon Weinstein when we used to do Master’s Degree Oral Defense Examinations together. He’d say “We don’t allow ‘hand wave’ explanations in math.” This means that you can’t get to a formula, for example, and instead of saying “we just solve it from here”. You MUST show your work and that includes showing every step of the solution. No hand waving as if it is so obvious that we don’t need to explain it.

    So this article does an uncomfortable amount of hand waving. It’s tucked in with weak evidence statements which I also indicate.

    👋 = hand wave evidence

    😔 = weak evidence, could be improved with more specificity


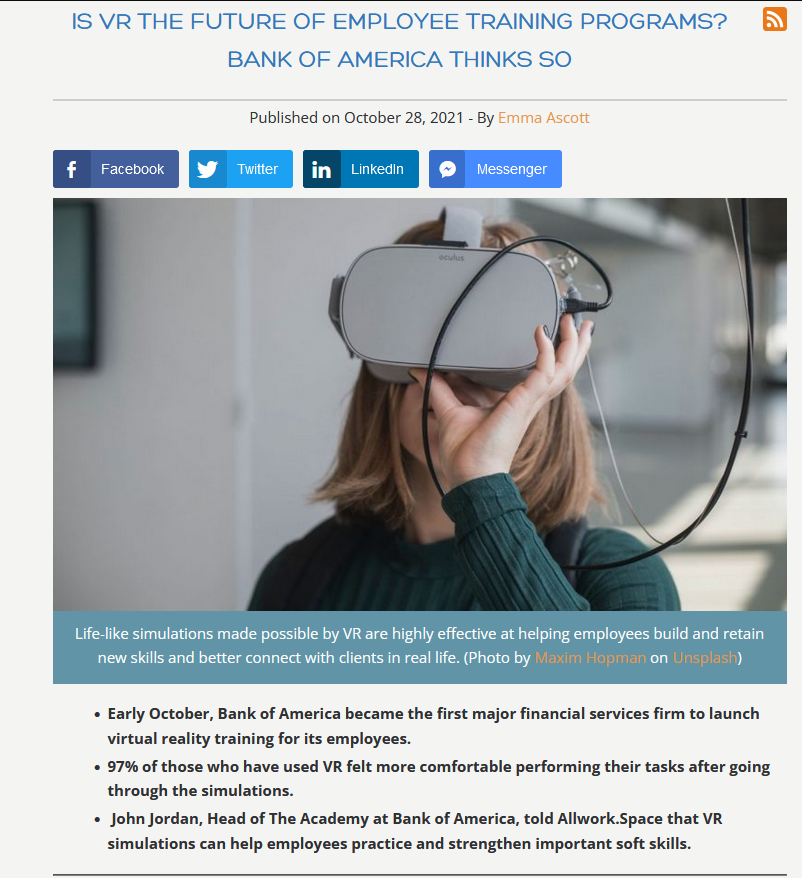
    Whether helping a client through a difficult moment or picking up on cues from a person who didn’t even realize they needed help understanding their accounts, the life-like 👋 simulations made possible by VR are highly effective👋 at helping employees 😔 build and retain 😔 new skills and 😔 better connect 😔 with clients in real life.   

    Currently, we offer five training modules but are slated to roll out a total of 20 different VR simulations that will help our teammates practice a wide range of skills such as 😔strengthening and deepening relationships😔 with clients and 😔 listening and responding with empathy.  😔

    We began piloting the VR program in 2019 and 😔after seeing its success in driving employee engagement and knowledge retention, 😔  [notice that they *could* tell you more about this success but they do NOT. So there are no claims of “better” here. We could guess that the VR learning was “equal” to other forms of learning.] 👋 it became clear👋 this was a program we wanted to extend to more employees.   

    👋We know VR is a highly effective,👋 immersive learning technology that
    helps teammates to be
    😔 more engaged 😔, [“more engaged” is really questionable wording for VR, it often seems to mean “we cut off all vision except what we want you to see and we dominate the sounds with what we want you to hear, so you are forced to pay more attention to the training.” See more engaged from the PwC report for further explanation of how this is problematic.] 😔 better prepared 😔 [what is “better”?] 👍 and develop new skills more quickly. 👍 [yes, agreed, quickly is the right word here IF there are enough headsets] It’s an 👋 intuitive tool 👋 [would the 12 think so?] 👍 that allows teammates to practice client interactions on their own time and at their own speed in a realistic environment. 👍   [OK, that appears to be true!]


    👋VR has shown early promise for replicating real-life scenarios
    and giving our teammates meaningful practice and confidence.
    👋Following a
    successful pilot with 400 employees, 97% of the participants felt more
    comfortable performing their tasks after going through the simulations.
    By giving employees the tools to be more prepared and confident in their
    roles, 😔 we can create a better overall experience for both our employees
    and our clients.😔    [that’s a reaching statement, but this isn’t research, so…]


    At Bank of America, we pride ourselves on being a great place to work,
    and that includes providing best-in-class learning programs and
    meaningful career growth opportunities. VR is one of the many ways we
    are using world-class technology to increase skill development, support
    internal mobility, and ensure all teammates have access to the resources
    they need to grow in their current roles and build new skills. 👋VR has a
    long list of benefits,
    👋but there are many other learning formats and
    advanced technologies that can be useful for training, depending on the
    need. 


    Not hand waving but just somewhat poor writing/editing

     At least twice, the article nearly word-for-word copies itself. Erp. I could be fussy, but that just seems suspect.


     3. Lack of needs analysis

    My designer buddies would recognize what a needs analysis or gap analysis is. It’s also the “A” section of the ADDIE design process. It means that training must solve a problem. If there is no problem, don’t design training. This article is not specific on what the problem was prior to the decision to use headsets. Admittedly, they are a business talking about a business decision so it is unlikely that they’ll say “our previous training was poor.” 

    The other flag that is noticeable is that BoA keeps justifying this decision along the lines of wanting to be first:

    Bank of America became the first major financial services firm to launch virtual reality training for its employees.   

    In early October, Bank of America became the first financial services firm to launch virtual reality (VR) training in all of its nearly 4,300 financial centers nationwide.  

     Bank of America is the first financial services firm to launch virtual reality (VR) training in nearly 4,300 financial centers nationwide, making this the latest in our long-standing investment in the success of our people. Currently, we offer five training modules but are slated to roll out a total of 20 different VR simulations that will help our teammates practice a wide range of skills such as strengthening and deepening relationships with clients and listening and responding with empathy.  

    We are constantly seeking ways to implement advanced technologies that
    offer better solutions for our teammates and our clients.  

    At Bank of America, we pride ourselves on being a great place to work,
    and that includes providing best-in-class learning programs and
    meaningful career growth opportunities. VR is one of the many ways we
    are using world-class technology to increase skill development, support
    internal mobility, and ensure all teammates have access to the resources
    they need to grow in their current roles and build new skills. VR has a
    long list of benefits, but there are many other learning formats and
    advanced technologies
    that can be useful for training, depending on the
    need.

    As a business, they can use that language. But it weakens the use of this article as “evidence” and some will try to do that.  


    Thus, I wrote this piece and will pass it out whenever needed. 


    Remember, I’m for virtual reality for learning. And I do entirely predict that the learners here with BoA will be able to learn the soft skills presented to them.  Yes.

    But when it comes to pass there are no learning gains (aka, it is not BETTER than, say, e-learning) for 50,000 employees over 4,300 financial centers, which leader is going to be OK with the cost of ~12,000 headsets and the cost to develop that training??  This is a major investment on a leap here.

    Man looks at graph that goes down and up.


    Over time, the cost to develop VR training and to own VR headsets will drop. Yes.

    Over time, any apparent “learning objective gains” by VR will normalize (the novelty effect will wear off). Yes.

    So can/should BoA continue with VR?  Yes. Sure.

    That’s not the problem.

    It is thinking that XR is new, amazing, and solves world peace in the training realm.

    That’s the problem.

    Because it does not. 

    I’ll stay vigilant and call out bad uses of XR when I see them.

    (more…)