|
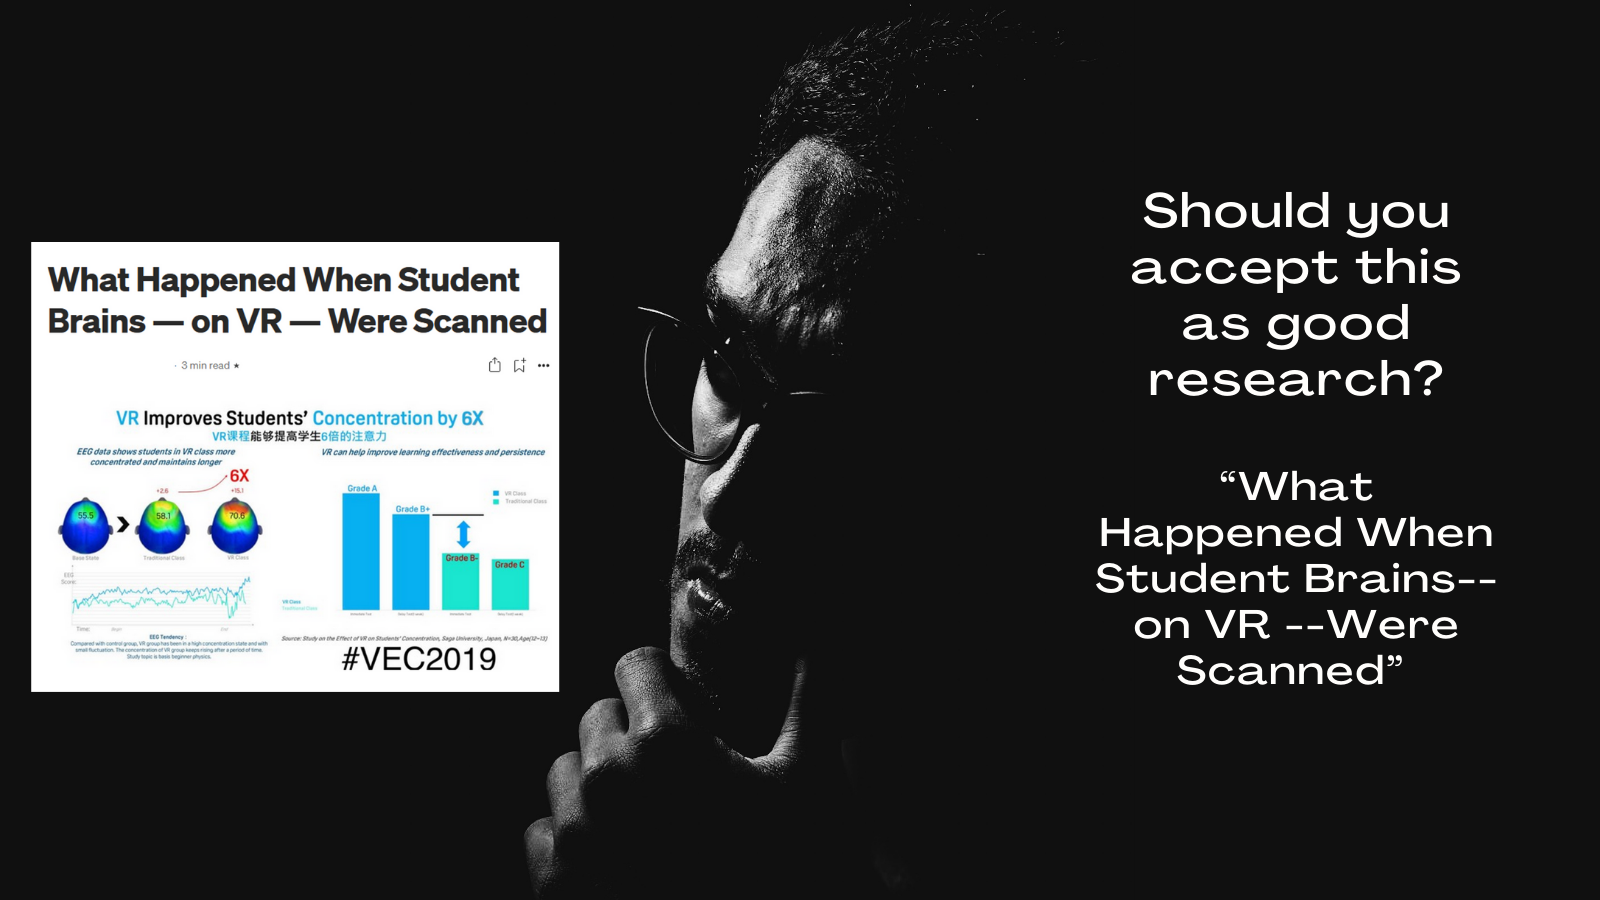
| Should you accept this, What Happened When Student Brains – on VR – Were Scanned, as good research? |
I believe that VR has a place in education. We’ll get there and it will be awesome.
However,
along the way, I will analyze and call out poor virtual reality and
learning research EVERY CHANCE I GET. Poor research helps no one.
I’ll be writing about several poor VR studies soon. I’m writing just like I did for my “Survey does NOT show that instructional designers drive better student outcomes.”
Even though poor research should be called out (yes!) I am NOT in the
business of embarrassing or humiliating a person nor damaging or ending
someone’s business. Therefore, I will block out names as much as
possible. If the source blatantly has names within it though (for
example, if someone names a company), I’ll keep that in the screen
capture. Note however, the minute time traveling teenagers arrive in my
home office asking me to truly name names related to this, I AM SO
TELLING THEM.
Seat belt sign on.
 |
| Seat belts on. It’s a bumpy ride ahead. |
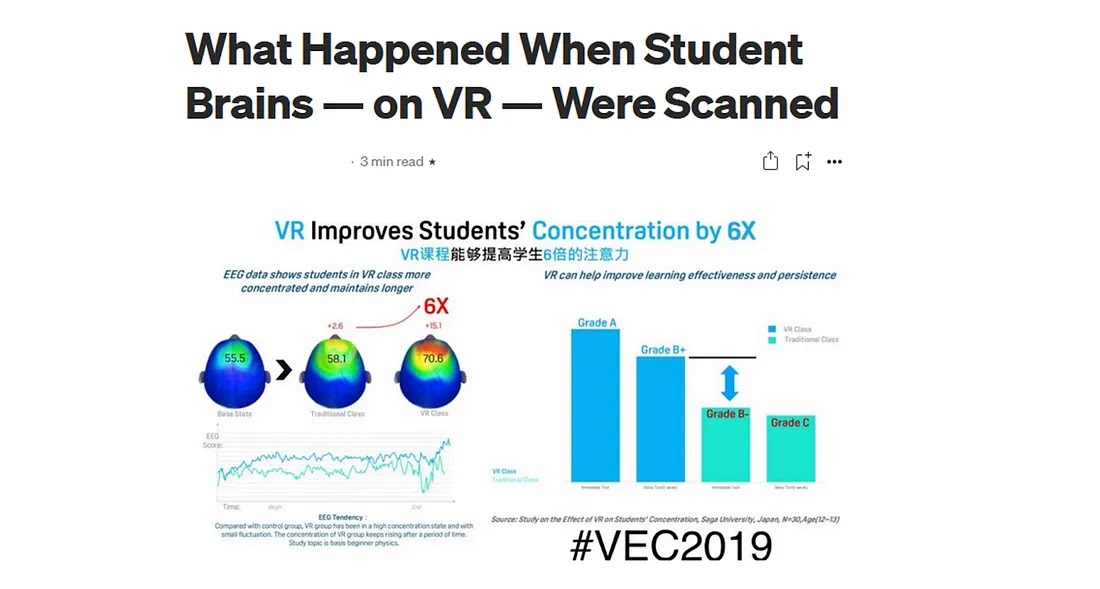
On July 25, 2021, an author that I’ll call Author A posted this story to Medium: What Happened when student brains on VR were scanned
Before you click on that link, remember that Medium is a site where
authors are paid for article reads. Now I post to Medium too (as a
matter of fact, I’m posting this article there as a sort of rock’em
sock’em method of seeing my article go head to head against his) but [EDIT: I no longer post to Medium] just bear in mind that the more you click, the more the author is paid.
Author A appears to have posted 6 articles to Medium and 4 of them are
about VR. (Update: during publication, this has increased, I’ll pick
this point up again at the end of this article).
(July
2021 version of this image, I’ve blocked the author’s account. Note the
added #VEC2019. I think it’s very obvious that the #VEC2019 was
overlaid.
VEC2019 is the VIVE Ecosystem Conference held in 2019.
Inside the article, I did hope to find sources.
Here is what I found (names blocked):
In July 2021, Author A posted to their own LinkedIn account
Partial capture of post here (blocked out the link and a name):
While you are looking at this though, does anything stand out yet?
Already for me:
- The writing style feels like it’s pulling me along (FIRST, SECOND, THIRD) but I tend to like my separate points to be actually separate and new points.
If you look at what’s written for each item, the points are more
chronological as if someone was talking than factual as if someone was
listing.
- I’m zinged by that “ [read the rest of the story here:
link ] That was actually written by the author, NOT hard coded in
by LinkedIn. Bummer. I wish I had NOT clicked on the link but I
sincerely thought that there was “the rest of the story” at the link. It
was the Medium article link so by clicking on it, I “paid” this Author A
some money. This means something. Stay tuned.
- I do a quick
mental check of the numbers in the post versus the image. As your math
teachers always said “Stand back and look at the numbers. Do they make
sense?” The 4th bullet just further describes (aka says the same thing
but with DIFFERENT numbers as the 3rd bullet so… is 15 roughly 6 times
2.5? Yes.
- OK, the number “6X” checks out within the diagram
(meaning that the data I’m provided with so far does align with the
head/images). However, your hackles should be going up because you
should be asking yourself “Why was the image of the heads not enough?
Why do I need to be told– in red font with a drawn line– “six times”?
Answer: because the phrase “Six times” will stick in my head and slow
down my reading and I will — as I’m sure MANY have done– quickly
breeze over the “six times WHAT” part and read this to say:
Six times more brain activity on VR
Rather than what it says, which is
The difference between the brain states is 6 times traditional.
- See?
Didn’t you read this as “Wow, the brain is 6 times more active on VR,
that’s got to be good!” (VR and autism researchers right here are
roiling; I can feel you. They are saying “An active brain isn’t
necessarily a learning brain.” Right on. You get your chance coming up
later.)
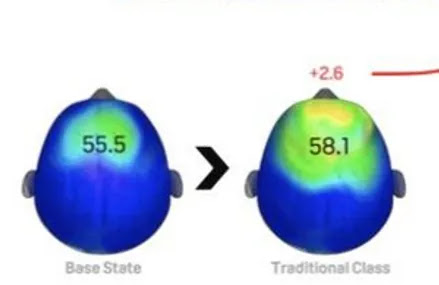
- One further point I noticed later. The “Traditional
Class” is pulling a 58.1 (unitless) over a Base State of 55.5. That’s a
2.6 difference. The image says 2.6, the writing says 2.5. I’m willing
to overlook this; that’s minor. But think about it for a second.
Traditional class work is pulling nearly the same brain activity as
“base state”. So bad news teachers: your students in class are one tick over coma. (I HOPE NOT!)
 |
| In all my years of research, I NEVER found the original source of this image. |
I’m linked with Author A and that’s how I saw that this image was circulating again.
Author
A linked to the Medium article within their post but they added this
image to their LinkedIn post. Therefore, the image appears prominently
like this:
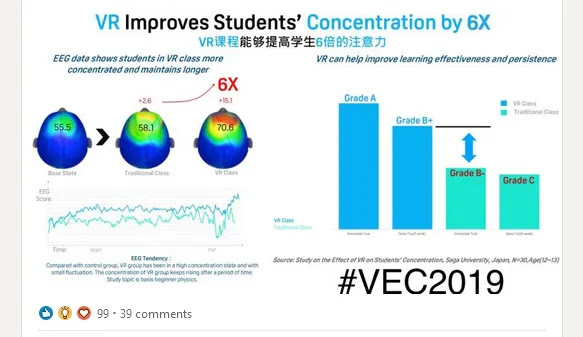 |
| LinkedIn post with image “VR Improves Students’ Concentration by 6X”. Image includes some Chinese characters and #VEC2019. |
Here is a version of the same image from 2020.
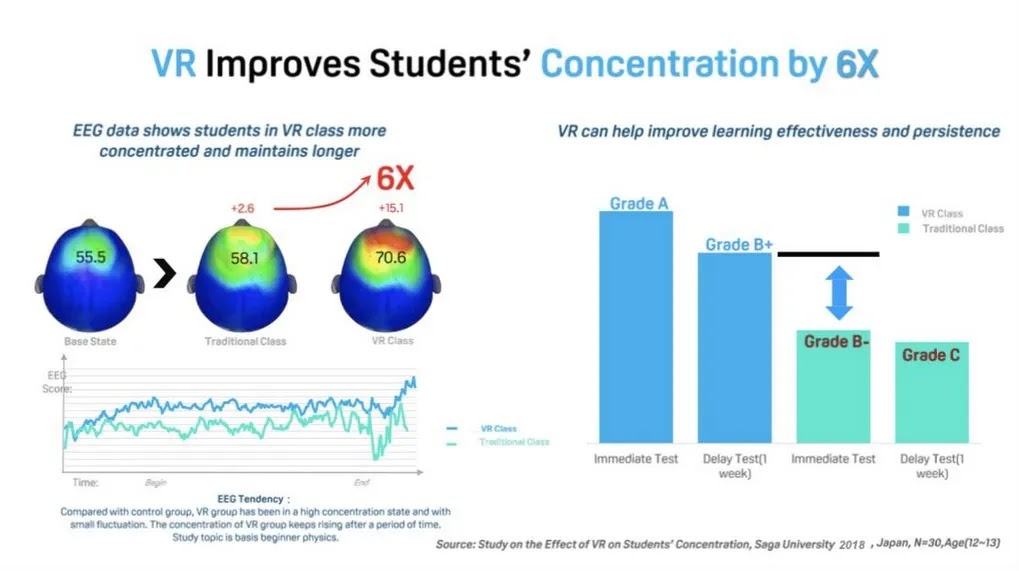 |
| LinkedIn post with image “VR Improves Students’ Concentration by 6X”. Image does not include some Chinese characters and #VEC2019. |
So
the Chinese line under the title is present in the newer version but I
don’t see any other changes. I did a Google image search and this
appears often on LinkedIn, but it’s not coming up linked directly to
another source (so far).
The images seem to have a “source” credited in the lower right corner.
Retyped here with kept capitalization but not formatting:
Study on the Effect of VR on Students Concentration, Saga University, Japan, N = 30, Age (12~13).
Capitalization
matters because it can indicate how much the author is following a
particular reference style (APA, MLA, IEEE, etc.) Also some statistical
and mathematical symbols change meaning if they are capitalized or not.
So six times the improvement of concentration on VR! That is an attention grabbing number!
I’m not the first person to report that FINDING that article by that name or some derivative appears to be impossible. However, looking at that citation, a few thoughts pop up:
- There
is a formatting change in the line that looks like text has been added
or overlaid. In particular, the age information is odd. Researchers
don’t usually add the sample groups’ age in a citation particularly when
everyone in the research study (supposedly) was of the same age. Ages
didn’t vary within the study. The N info can be properly included in a
figure caption, which is different from a citation. So this info looks
like a blend of an attempt to give a citation and more information…for
perhaps “people who were asking”? (I BET.)
- It is entirely
possible that this source was published in a language other than
English. The title is academic-looking but academics are also sticklers
for choosing the exact words to reflect what we mean and this title is
actually a little wordy. That tips me off that it might be a
translation. For example, tight academic English would have been “The
effect of VR on students’ concentration.” All through some of the
sources I go through next, I have the feeling that I’m dealing with a
good-hearted translation. Good intentions, yes, but not the original
author’s thoughts. Hmm.
In 2020, a few other images and a link circulated associated with this research.
Shared on Facebook as “slides” from a conference talk:
 |
| Take note of the learner’s clothing and the Source. |
|
| This version has the “6X” in big red font with an arrow. |
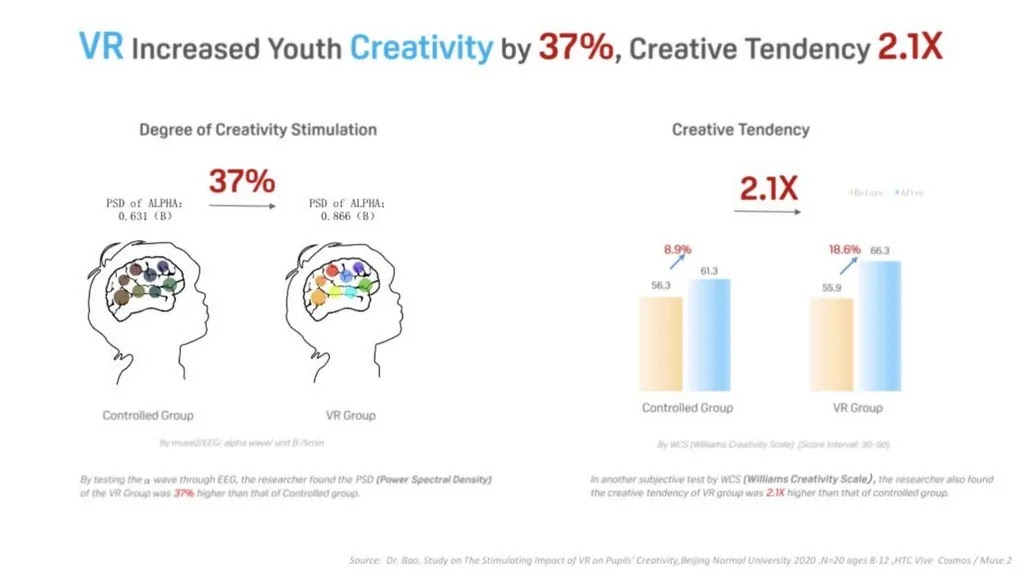 |
| “VR Increased Youth Creativity by 37%, Creative Tendency 2.1X” |
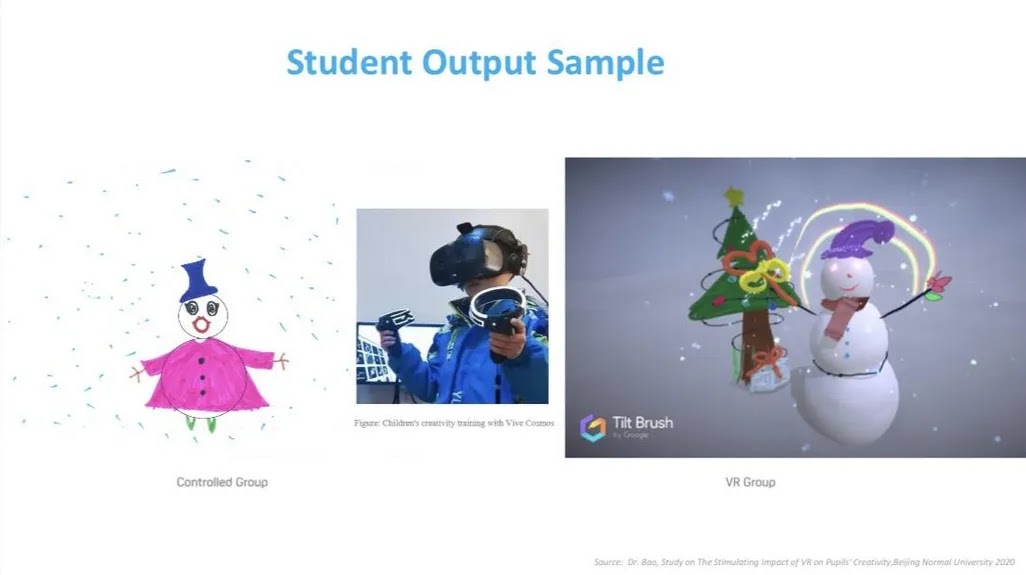 |
| “Student Output Sample” Personal comment: I find this comparison disgusting, laughable, and then disgusting again. |
There was a suggestion that THIS is the actual study here: A Case Study – The Impact of VR on Academic Performance
https://mk0uploadvrcom4bcwhj.kinstacdn.com/wp-content/uploads/2016/11/A-Case-Study-The-Impact-of-VR-on-Academic-Performance_20161125.pdf
For the next part of this article, I’m really getting in the weeds of the research. Get a cup of coffee and keep up.
As
a summary of the research a teacher separated students into a control
group and a VR group. Then each of those groups was measured for
learning either in the same class period or two weeks later. The VR
group was compared to the control group.
Note that the control group is the “Traditional” is a teacher talking with a PowerPoint for 30 minutes.
Remember that Intermediate refers to the ‘same day’ test and Retention refers to the test 2 weeks later.
Before I get into some problems, I’d like to say a couple of items in this teacher’s defense:
- First, it is clear that the teacher means well and is supportive about the use of VR in the classroom.
- Second, the teacher taught an astrophysics lesson. Physics content is an area of ideal use for VR because
of the conceptual and sometimes “hard to see” type of content (hard to
see atoms, hard to conceive of galaxies, etc.). There is always a direct
relationship between “seeing” and understanding when trying to use VR.
- Technically,
self-publishing isn’t awful. I do that myself. I think more publishing
will be self-publishing in the future. But I’m also NOT SELLING
SOMETHING and not dangling the data behind paid links (cough, Medium) or
concealing references to support eye-popping results. Don’t forget, it
said SIX TIMES.
Inside this paper, there are some concerning misfires.
The
first would be the experiment design. It is poor ground to stand on to
compare not cognitively equivalent experiences. PowerPoint versus VR
is not a fair fight and just with that item, that research shouldn’t be
published.
Second, as I read through to get my bearings, the
author seems to put some of the wrong data in the wrong places through
the paper (they talk about the Intermediate data last and the Retention
data first when those were administered in the opposite order) and then
they attribute the averages backwards. It’s like the paper had a cut
& paste festival run through it.
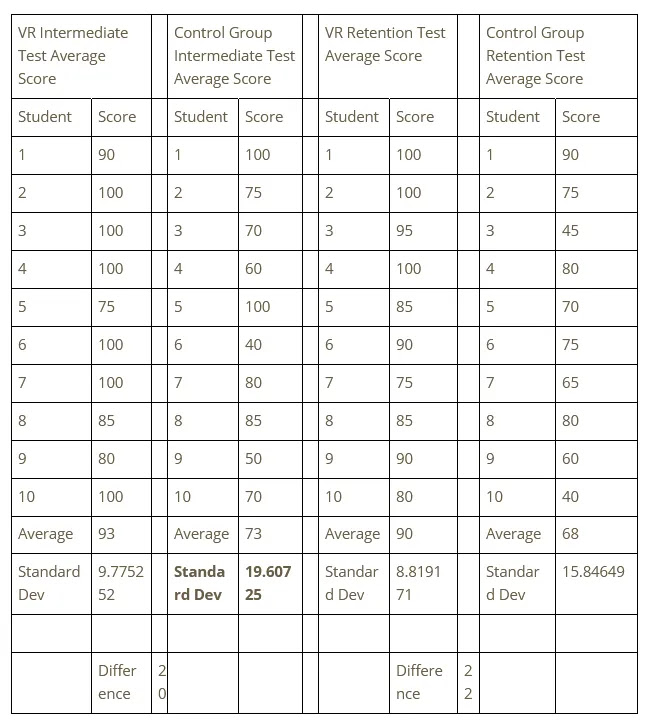
Example page 9, in a section talking about the Intermediate test, subtitled “VR Improves Test Scores”
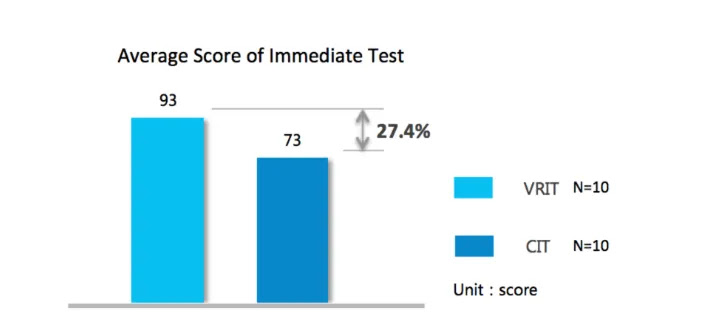
“The
average score of the VRIT group is 93, CIT, 73. On average, VRIT group
has registered a 27.4% growth in terms of score, indicating the great
advantage of VR in the teaching of astrophysics.”
OK, that first sentence is true. Here’s my data check:
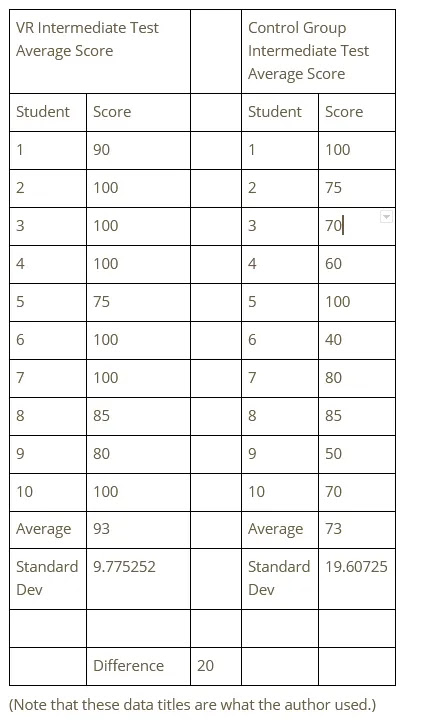
I also get averages 93 and 73. But the difference between 93 and 73 is 20, not 27.4.
Then on page 10, there is a graph that immediately followed this text:
Both
the text here and the graph indicated that the gap between 93 and 73 is
27.4%. It is not. It is 20. But I’m trained to look for “accuracy”
that suddenly arrives that wasn’t present before. Where did that 0.4
accuracy come from?. And how did the percent symbol sneak in? The
percent symbol isn’t anywhere else in this image (red flag). Does that
27.4% look pasted on? Why? I’d cry “Significant Figures!” here but the
27. 4% does show up on Page 14:
“4.2.1. VR Improves knowledge Retention
In
Retention Test, the average score of VR group is 90, while that of the
traditional teaching group is 68. The gap between the two average scores
is 32.4%, higher than that in the Immediate Test 27.4% (# 4.1.1-1),
suggesting that knowledge taught in traditional mode is more inclined to
be forgotten, while VR-based teaching could help students get a deeper
impression and maintain long-term memory because it creates a quosi-real
environment, interacts with students and make students more involved in
the teaching.” [spelling in context
OK, so now the text says that the difference between 90 and 68 , which is 22 points, is 32.4%!
OK, so they are not trying to communicate the point difference (a
number), they are communicating, on purpose, a percent difference. Ah!
OK. Points and percentages are different, and they know that. Now I feel
better.
But notice, why would you convert one set of numbers like this:
- Hey the difference was 20 points!
To another set of numbers like this:
- Hey the difference was 27.4%!
Answer:
27.4 is interpreted as “bigger” than 20 even though, in this case, they
are the same (percentage and points, respectively). Sigh. It’ another
instance of the SIX TIMES difference. If I make the number appear more
impressive, I have more of your attention.
Folks, this is exactly
what peeves me here. Remember that I WANT this research to be positive
and true. But when you manipulate the numbers just to get me to go wow,
I’m on to you. I get extra angry when you are making money off of this
manipulation.
In 2020, I commented:
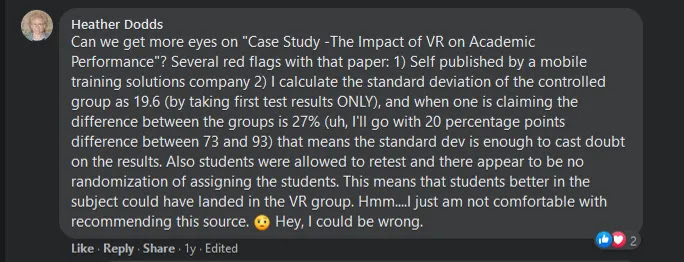
“Can we get more eyes on “Case Study – The Impact of VR on Academic Performance” Several red flags with that paper:
1) Self-published by a mobile training solutions company.
2)
I calculate the standard deviation of the controlled group as 19.6 (by
taking the first test results ONLY) and when one is claiming the
difference between the groups is 27% (uh, I’ll go with 20 percentage
points difference between 73 and 93) that means the standard deviation
is enough to cast doubt on the results.
Also students were
allowed to retest and there appear to be no randomization of assigning
the students. This means that students better in the subject could have
landed in the VR group.
Hmm….I am just not comfortable with recommending this source. Hey, I could be wrong.”
I
want to spend just a little more time on the stats. First, standard
deviation. Refresher! Standard deviation is a descriptive number that
describes how well the average describes the group. Quick example:
One
class: 2 students. Students score 45 and 55 on an exam. The average is
50. The standard deviation is 5. That means that a random student, if I
could mix all the students up and just pick one student out, differs
from the average score by 5 points. Said another way: most students are
scoring with 5 points of 50. And this is true. In one case, if I picked
out a student, they’d be scoring 45, which is 5 points off the average.
In another case, the student would be scoring 55, which is 5 points off
the average. Five points off and five points off. That’s good, that’s
‘tight”. Therefore the average of “50” is a nice tight description of
how the class is scoring.
One class: 2 students. Students score 0
and 100 on an exam. The average is 50. The standard deviation is 50.
That means that a random student differs from the average by 50 points.
Said another way: most students are nowhere near the average score.
They are missing it hugely. Both students are off by 50 points. The
average of “50” does NOT describe this class scores very well at all.
It’s junk.
So you generally want small standard deviation numbers if you want to believe that your average number is a good descriptor.
Let’s go look at those standard deviations (I calculated) again.
So
I calculated the standard deviation in 2020 of the Control Group
Intermediate Test Average Score to be 19.6. Same result by recalculating
that in 2021 (so I’m using myself as my own data checker by inserting
time between the 2 calculations).
That is troublesome. A standard
dev of 19.6 when the difference between the 2 groups was 20 means that
the control group could, reasonably, waver from ~53 to ~93 on their
score and still be considered “OK” and reasonably near the group
average. But that means that the control **could have scored** near the
VR group. 93 is quite near 93. (#fact)
So, a statistical flag on
that play. When you have reason to think that your experimental group
and control group **could have* scored the same, you do not have reason
to think that cause and effect has happened in your experiment, you
should doubt that your independent variable caused your dependent
variable’s results.
In plain language, VR could not be causing higher scores. Higher scores could have happened by chance.
This
is what I meant when I said that this data does hint that “students
good at VR” could have simply been sorted into the VR group
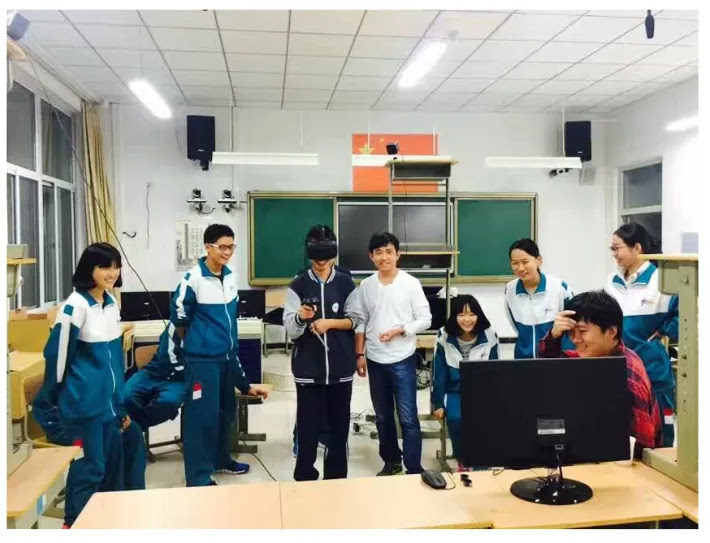
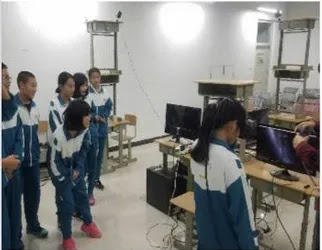
unintentionally and thus, voila, do great at the content. (The photos of
the students admittedly look like they are ‘having a good time.’)
Statistics is meant to help us know how much to believe in some numbers
and doubt other numbers. (Remember the line: Lies, Damn Lies, and
Statistics?) I know this is deep math for some, but it’s just saying
that these numbers are not believable as they stand.
Also, I want
to point out that I’m NOT strong in “power” talk in stats, but this is
the field of being able to know how many individual data points you need
before you can trust a whole set of data points. Data points are known
as “N”s. An N of 10 is quite ridiculously low for a sample size. 10
students are nice but no one should be spending thousands of dollars
buying headsets or software because of data from 10 students. And
remember, when you are seeing these numbers, you are being convinced to
buy. You are NOT being convinced to research deeper. More on this is
coming after some more scrolling down.
Finally, one last big item that you might have forgotten down in these weeds:
|
| After all that searching, where is the EEG data? |
Where’s the EEG data?
Well,
not in this paper, that’s for sure. But the image you are looking at
has only ONLY half-hearted reference on it (lower right). Where does
the EEG data come from? I tried to find it both by topic and image
search. Maybe that’s where “Saga University” comes in? I don’t know.
Word on the street is that that EEG data is made up. I really don’t
know. I can tell you that I’m suspicious because I’m not sure why one
would research on VR with EEG (a reasonably expensive test), publish
your results in color, find six times more activity and then bury your
published paper about it? Seems fishy to me. Again, though, this could
have happened all in another language and me and Google are failing to
find it.
There’s possible other stats problems in the paper but I’ll let it rest.
Also
circulating from 2020 was this one long infographic that I screen
captured into slices. The images are grainy, I know. (sad face)
 |
| Presentation slide: “VR-based Education Shown to Enhance Academic Performance, November 2016” |
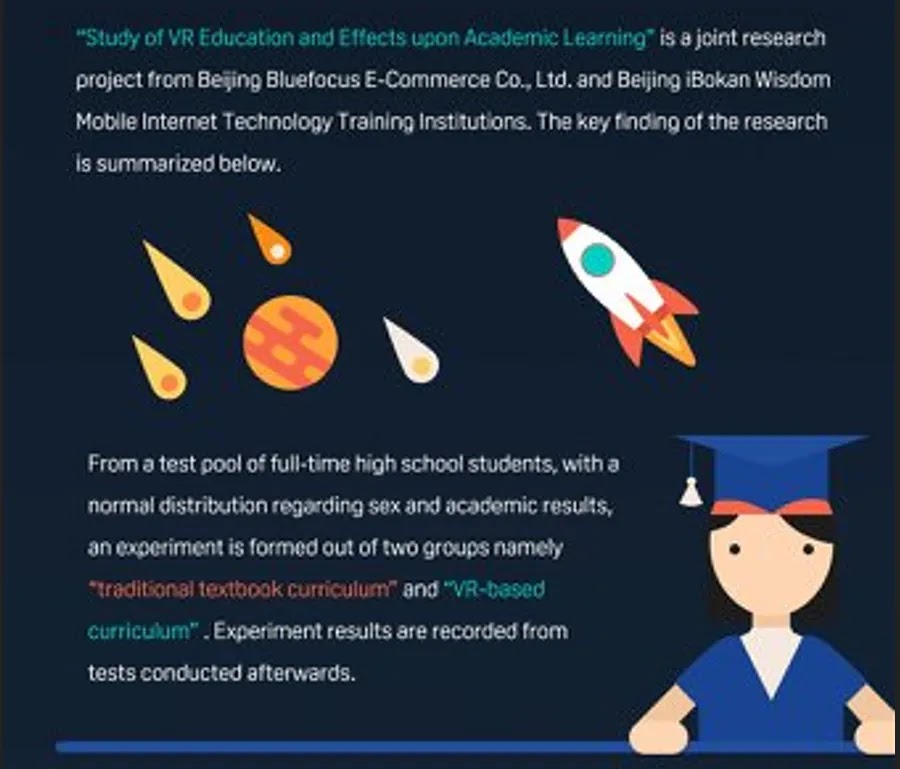 |
| Slide from presentation. |
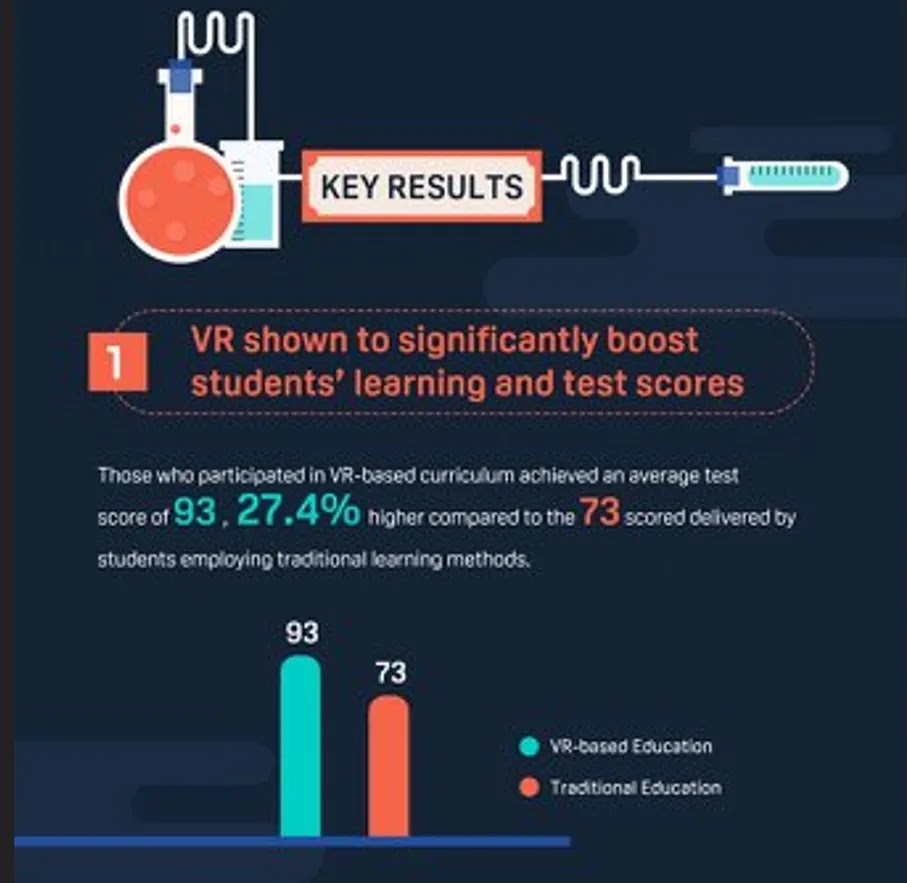 |
| Slide from presentation with text “VR shown to significantly boost students’ learning and test scores” |
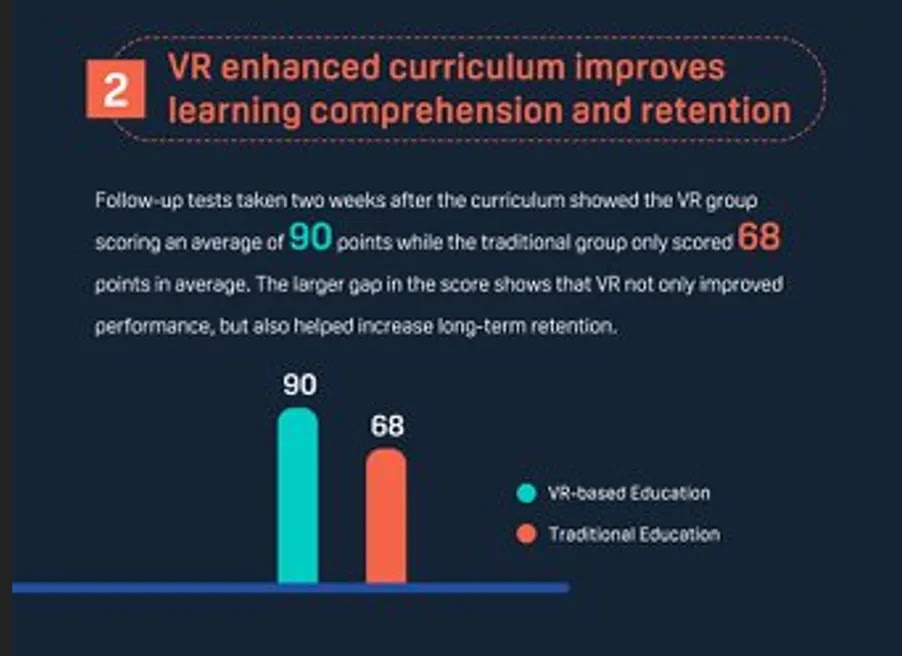 |
| Slide from presentation with text: VR enhanced curriculum improves learning comprehension and retention |
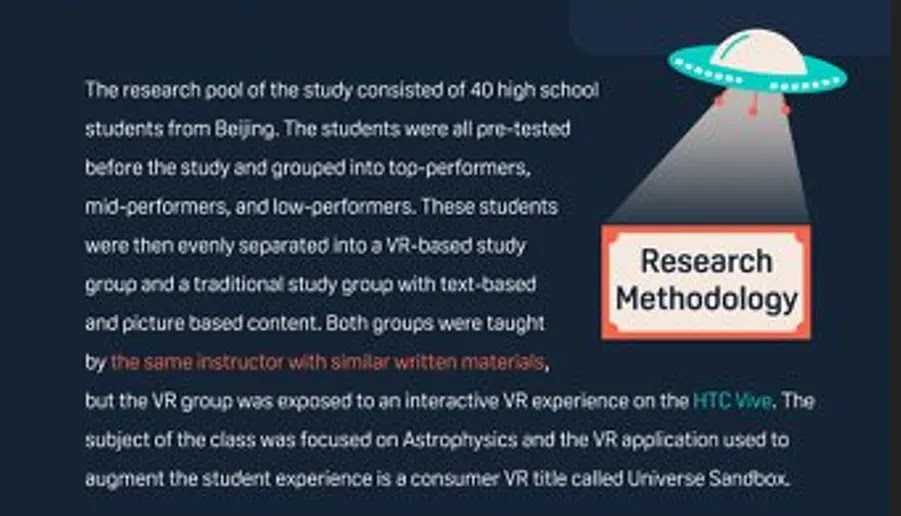 |
| Slide from presentation emphasizing that the control and experimental groups had the same instructor |
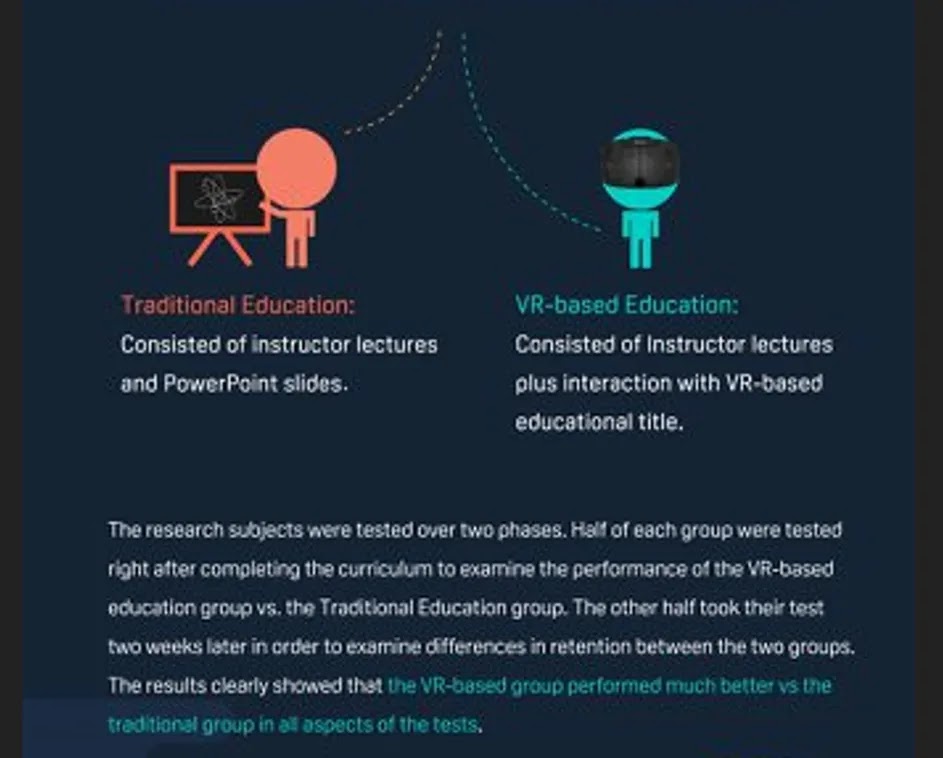 |
| Slide from presentation emphasizing that the VR was additional to the traditional instruction. |
 |
| Slide from presentation with QR code. Note prominent VIVE logo. |
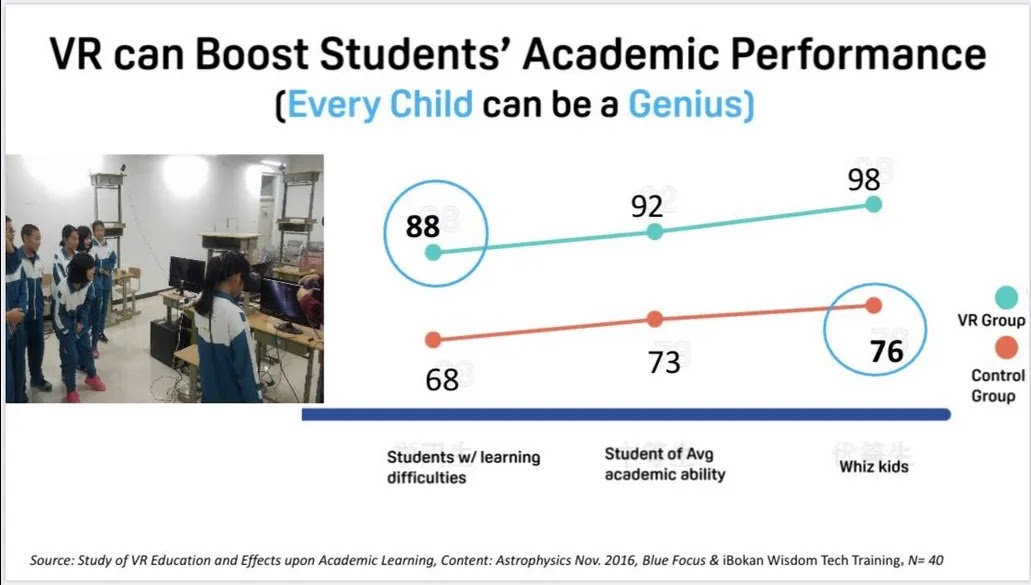
This
infographic appears to be supporting this image. The “Every child can
be a genius” phrase and the numbers appear to be the same. I have only
one item to say about these slides: cute UFO theme.
Note that the student clothes looks similar:
I tried to find “Study of VR Education and Effects upon Academic Learning” Google Scholar and Google can’t seem to find it.
Searching on iBokan Wisdom Tech Training instead, it seems to be used as a reference from here: https://www.degruyter.com/document/doi/10.1515/phys-2017-0114/html
To: here:
[5]
Beijing Bluefocus E-Commerce Co., Ltd. and Beijing iBokan Wisdom Mobile
Internet Technology Training Institutions, A Case Study – The Impact of
VR on Academic Performance, 2016. Search in Google Scholar
That is a dead end, as in, dead link:
Back
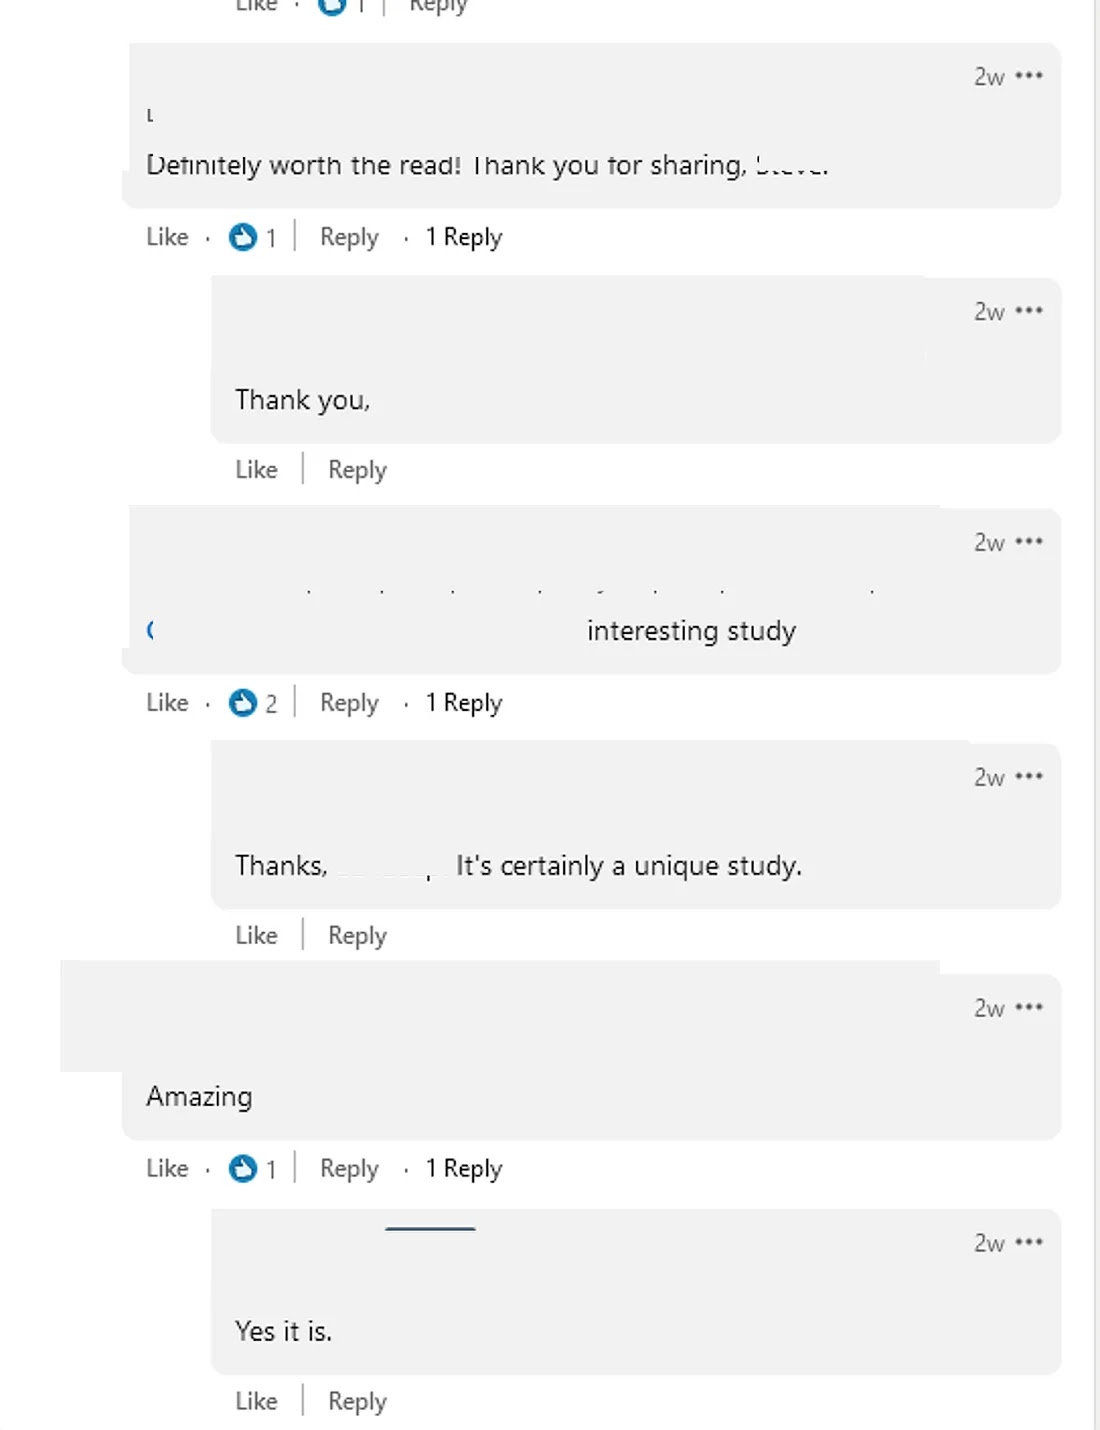
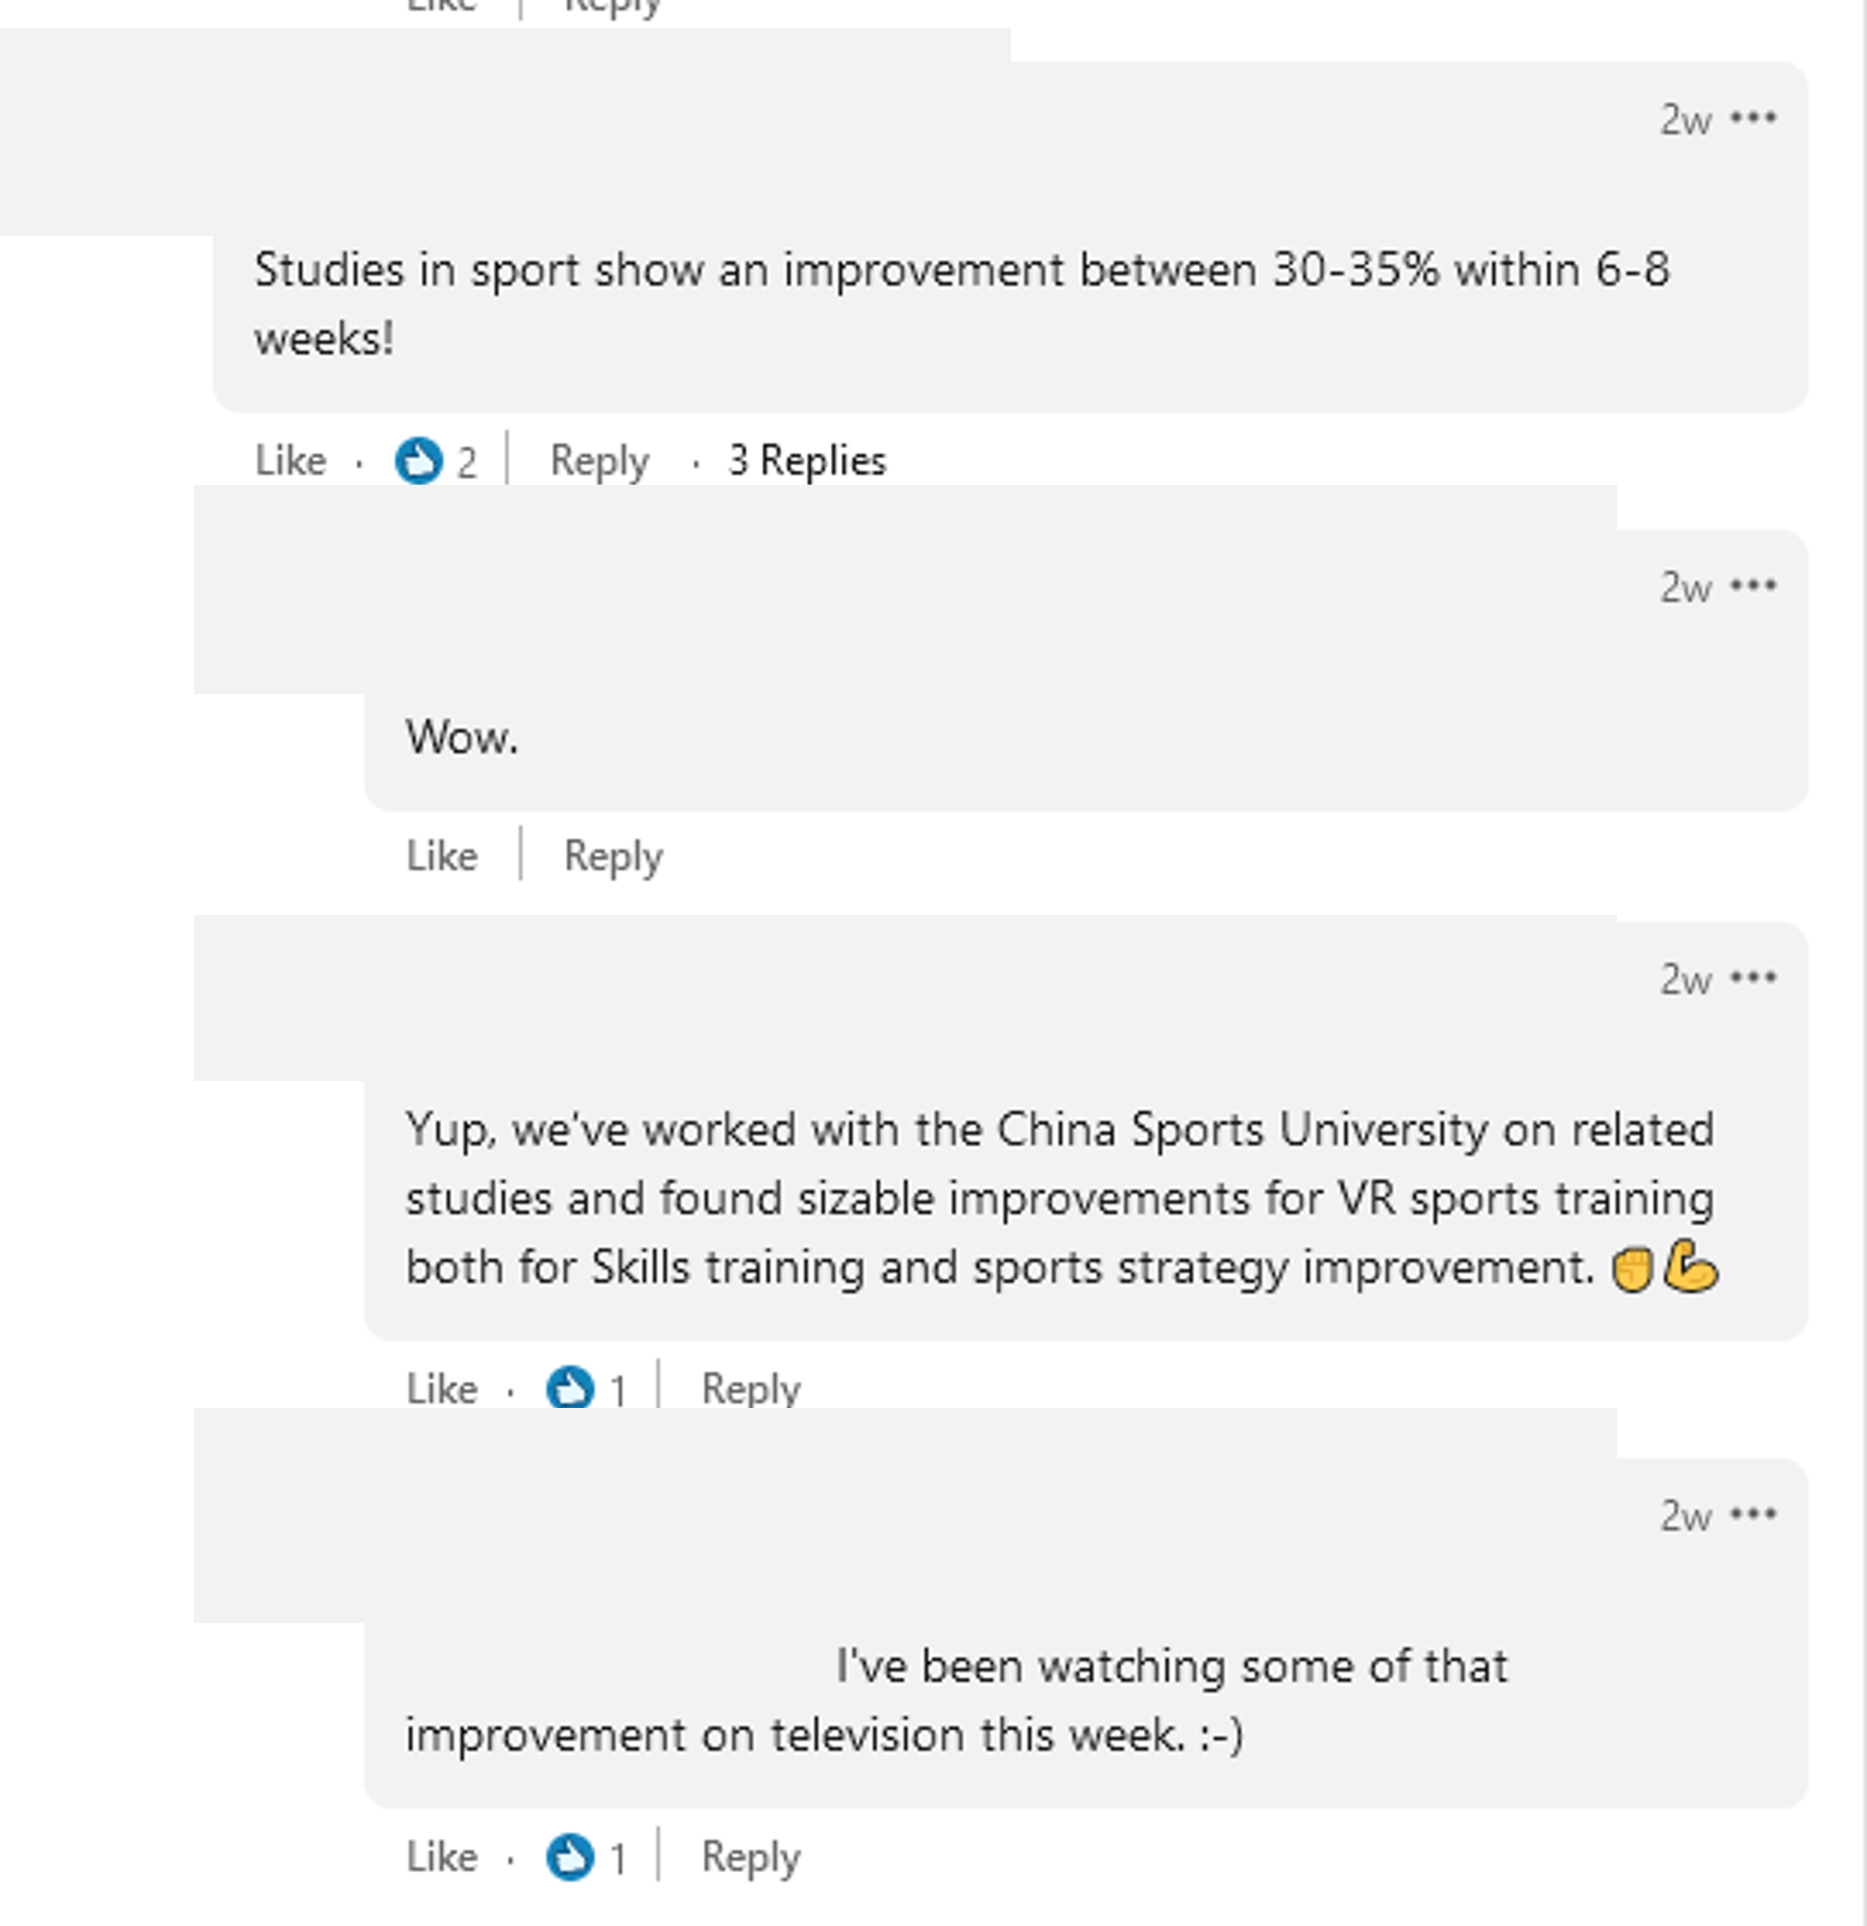
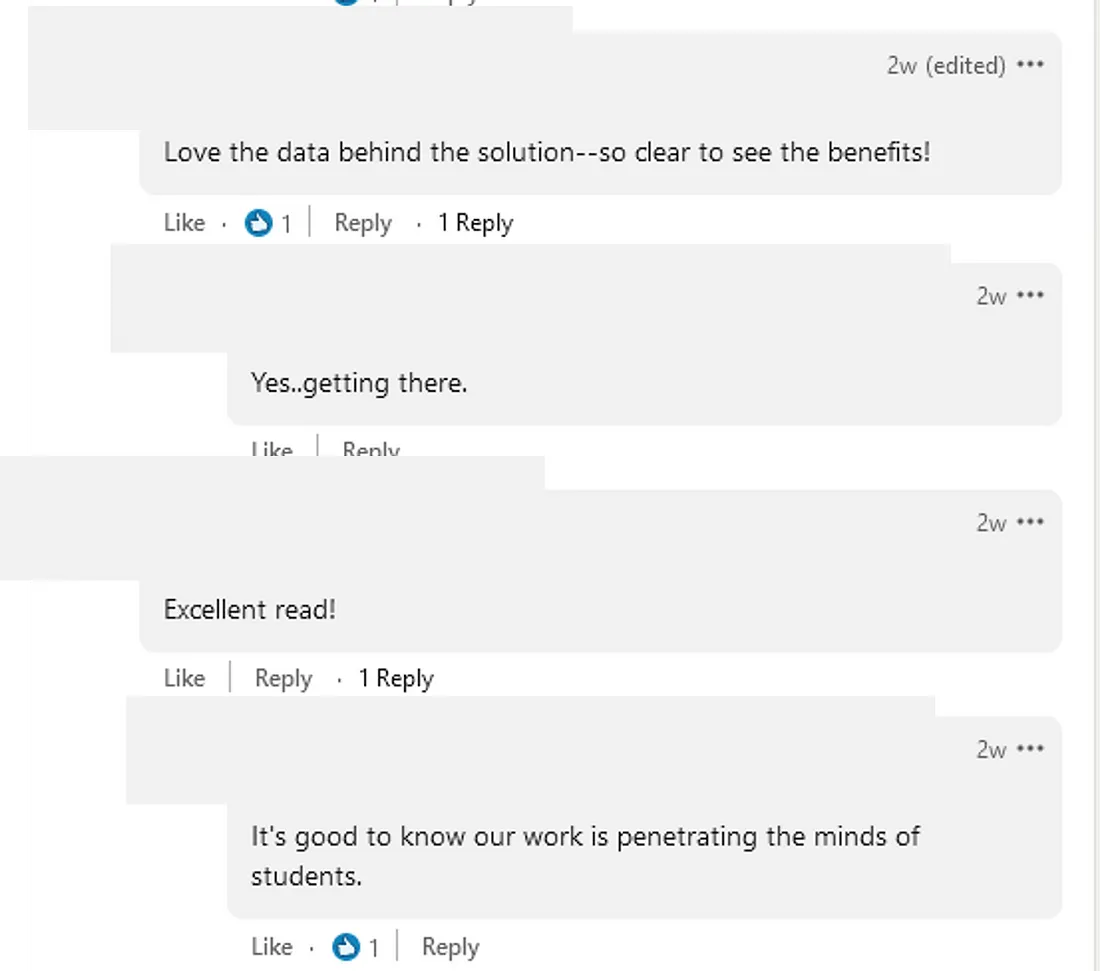
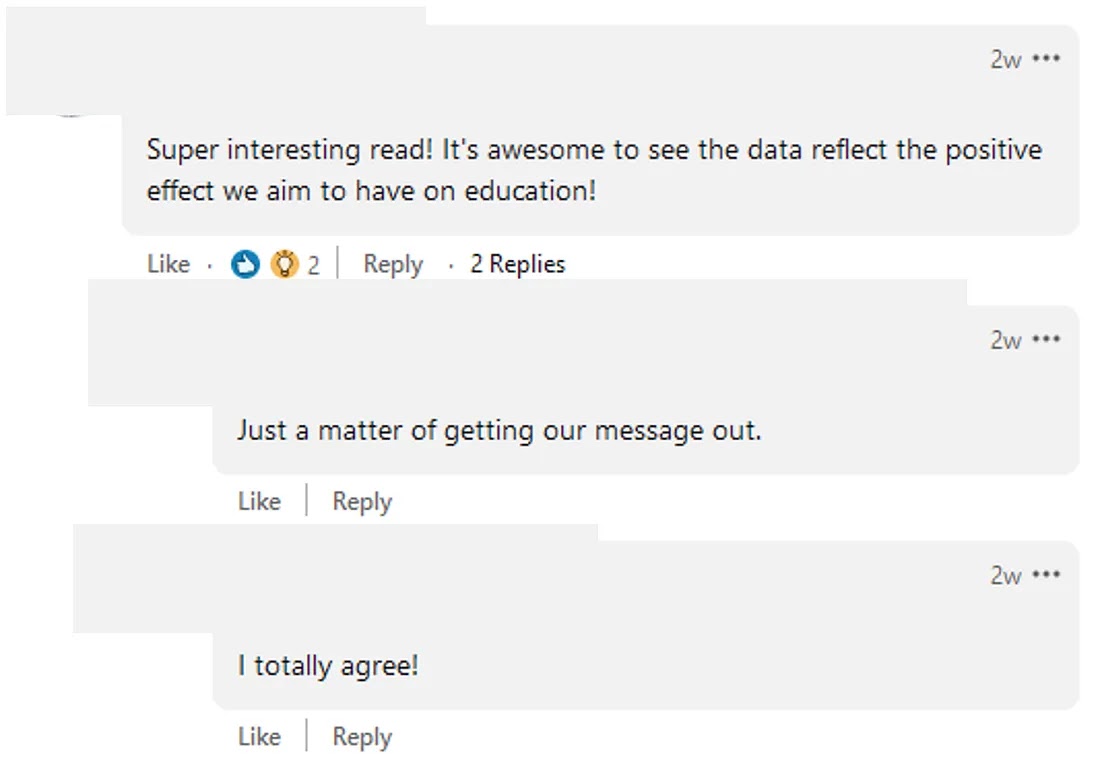
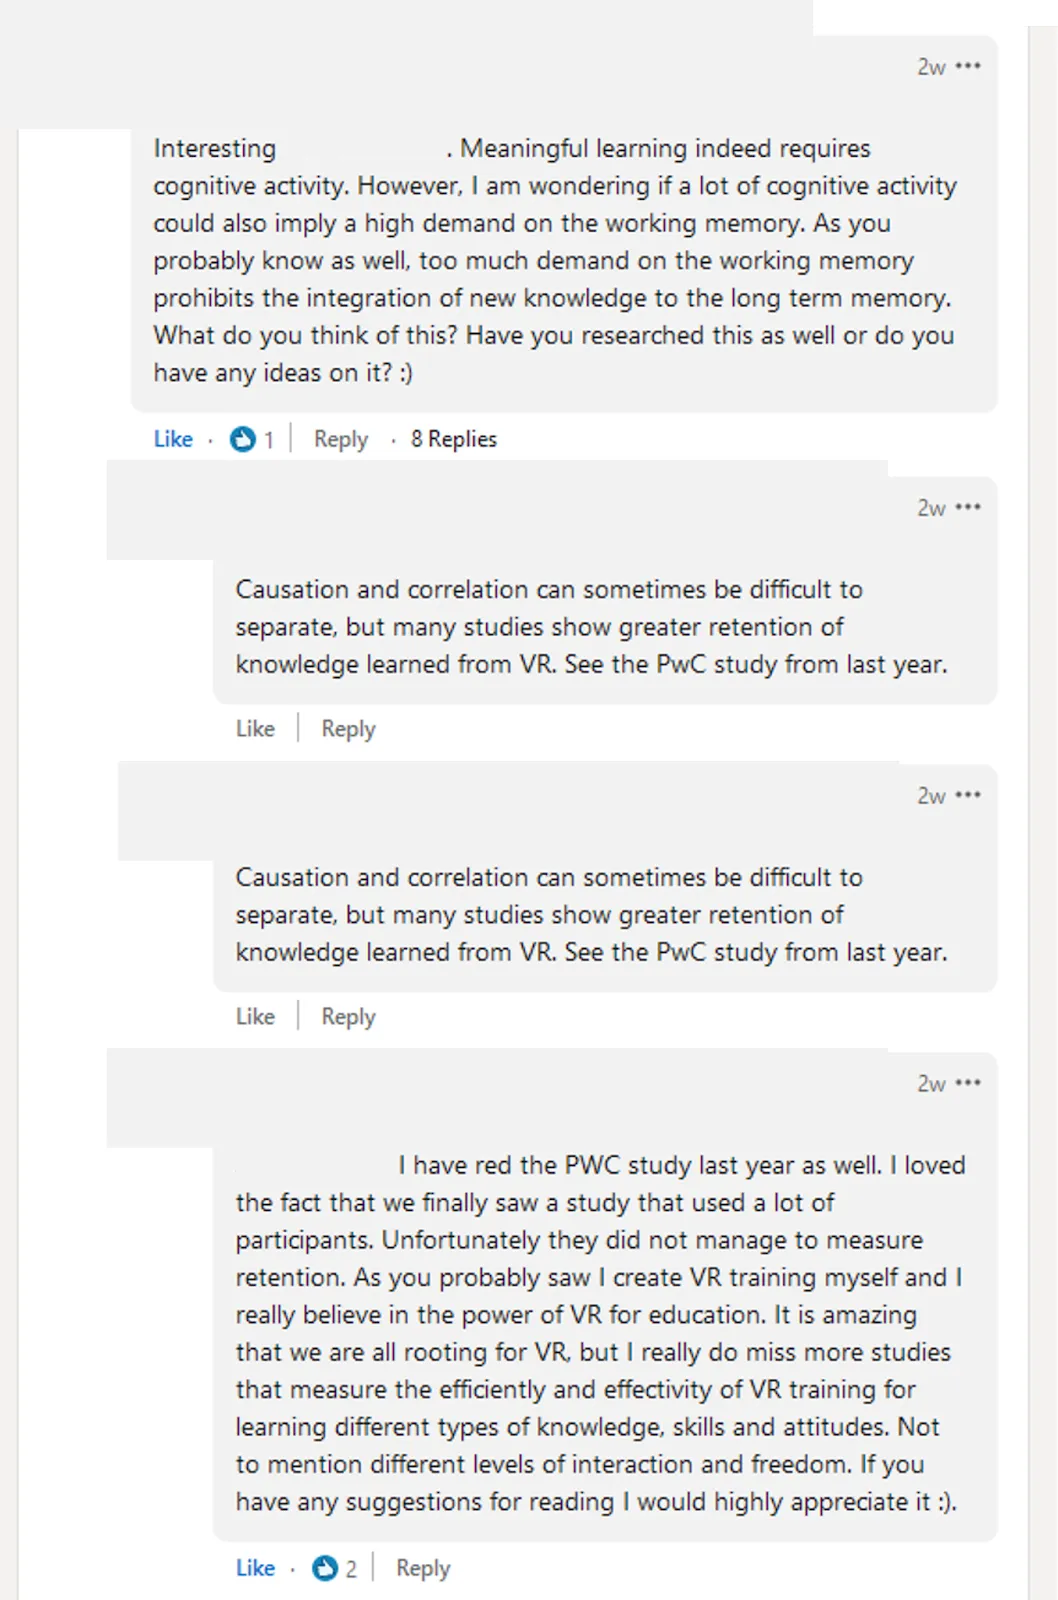
to the August 2021 comments. Notice how even if this data cannot be
substantiated, folks are still eating it up! 99 reactions last I
checked:
Who needs sources?
(Blocking all these names is making me crazy!)
Or at least, they are eating it up if they work at that same company as Author A.
But there are a few of us VR Research Jedi’s prowling that send up warnings.
My
colleague is much more even in tone than I am but they do strike the
right balance with saying that we ARE hoping to find positive learning
research as it relates to VR.
But this isn’t it.
P.S. I don’t know why Author A posted twice. Zealous much?
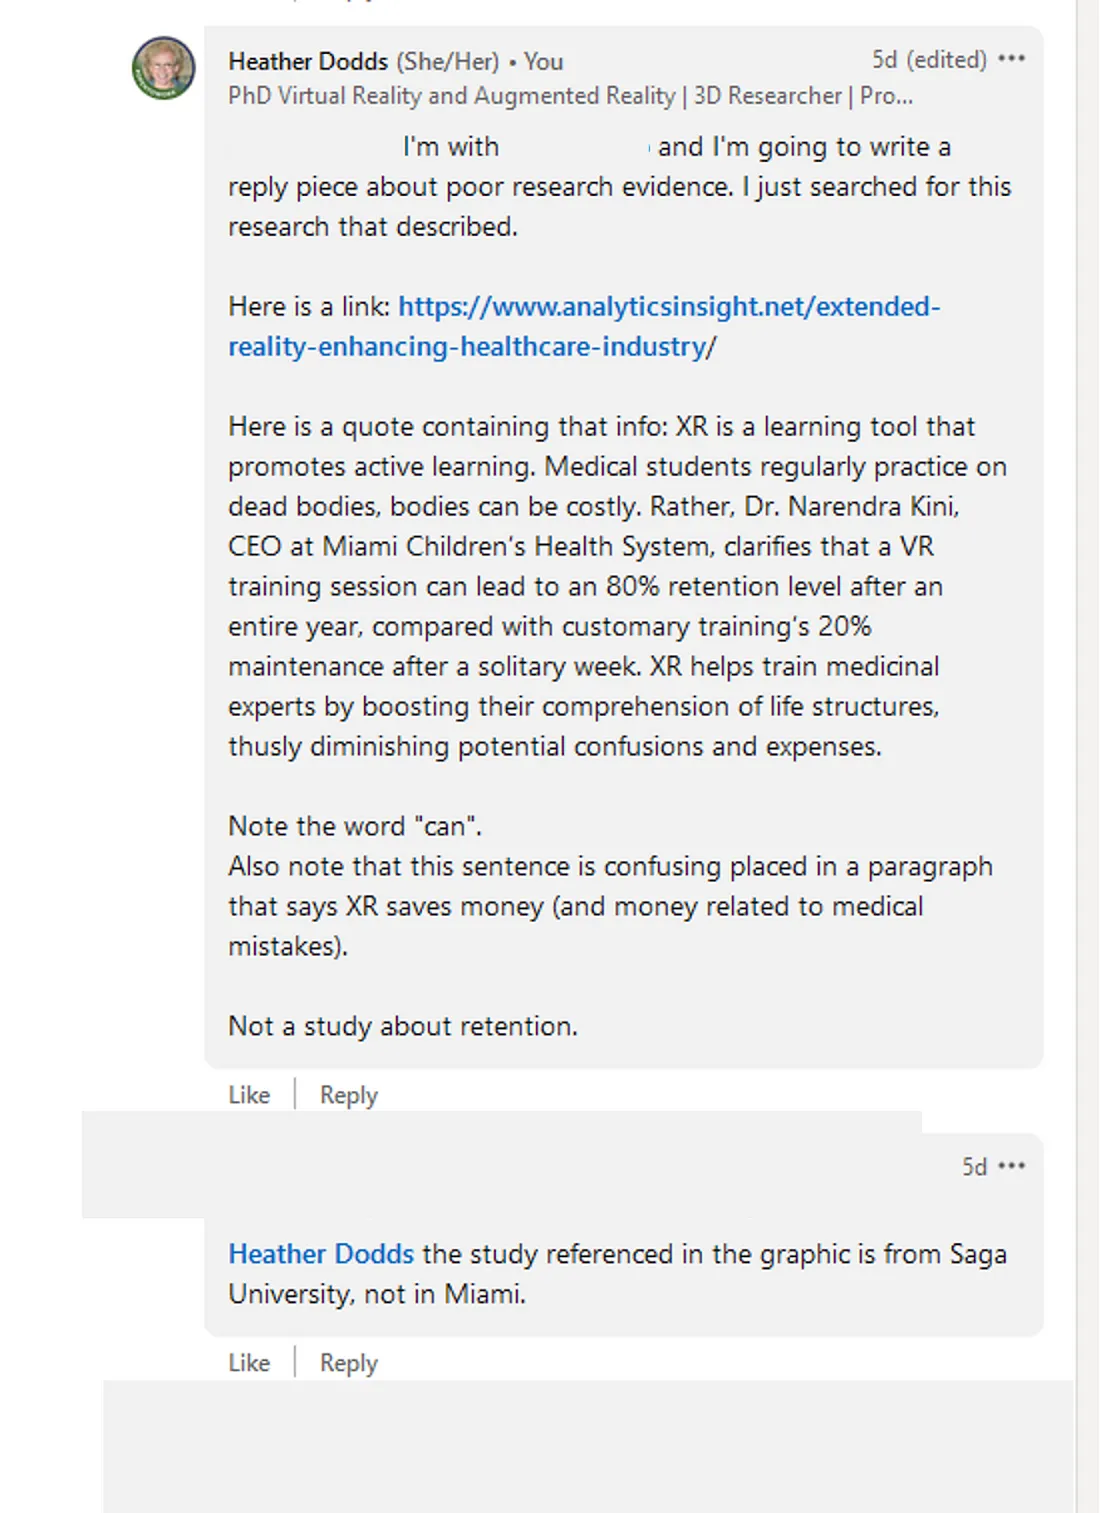
I’m coming in here. This is the link I share: https://www.analyticsinsight.net/extended-reality-enhancing-healthcare-industry/
Uh.
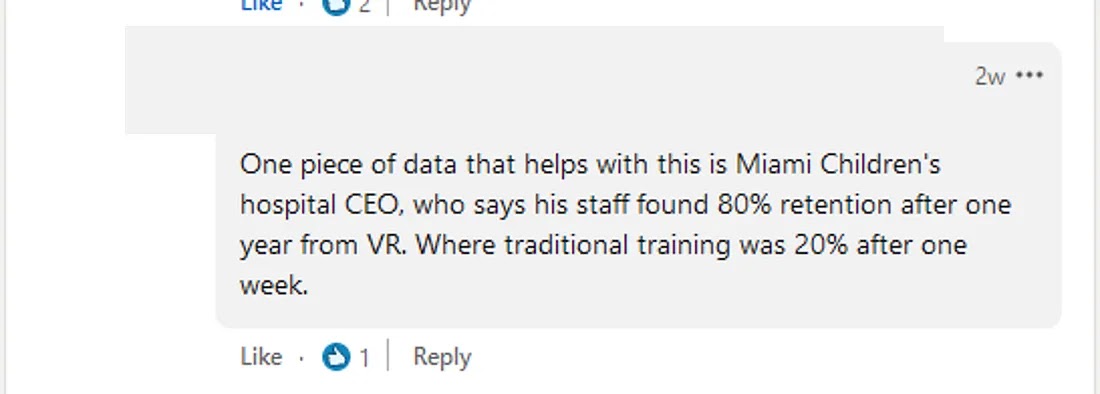
I didn’t respond after this. Author A apparently didn’t realize that I
was questioning the research in HIS OWN reply immediately above about
the “Miami Children’s Hospital CEO”. Perhaps he thought I was so
excited about his first graphic.
If you cannot properly mansplain to me, I just don’t know what else to say.
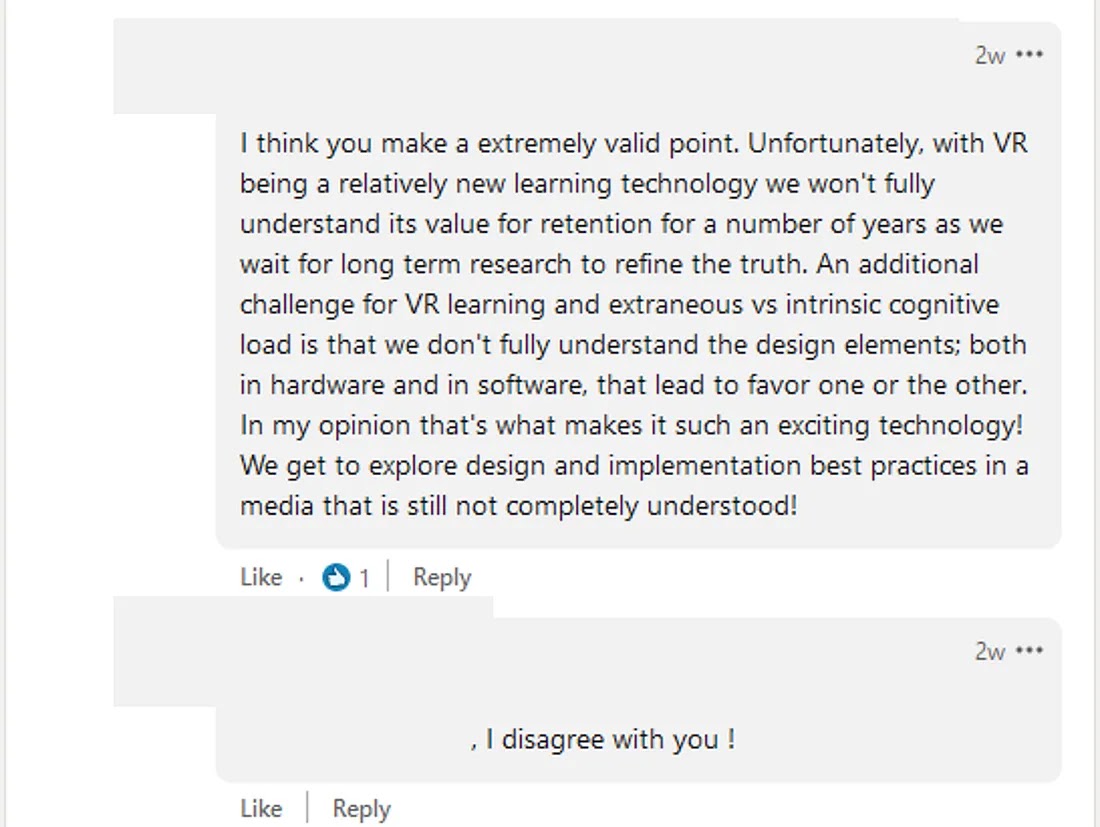
Note:
side fight broke out! Although, I’m not sure what they are fighting
about… I suspect autocorrect did it because that’s one perky
disagreement. Tee hee hee…
There
is one honorable mention of a person that asked for “we need a
concerted effort to also communicate the methodology and external
validity for such research. For industry adoption, particularly
healthcare, the core elements of research must be extracted and
communicated alongside the highlights”
Hey, nice try buddy!
Note that all of the positive supportive comments came from people working in the VR industry. That’s not bad, it should just be noted.
If you are selling me something, don’t I have a right to doubt the research you hand me?
FYI,
during the writing of this article, this same Author A continues with
the “I’ll tell you something tantalizing about VR!” and then makes you
click on a link where:
He makes money.
He doesn’t have to give you more information or sources.
That LinkedIn link right there? Goes to Medium, for a “2 minute” article. I didn’t click on this.
Why does all of this matter?
Because
media will never influence learning. Yup. I’m a Clarkist. Studies
that say that VR makes eye-popping differences in learning is not
supported by every media study we’ve ever done as humanity since the beginning of time.
If
we go around telling everyone that all students will be geniuses and
that VR will cause six fold increase in grades, those of us that DO
support VR for education are going to be out of jobs pretty quickly as
that bubble will pop.
~~
I recently watched Exodus: Gods and
Kings and I love this exchange between Moses and Malak (who is the
messenger of God). Moses is fed up with Egypt/slavery and is being told
to cool his jets by God.
Moses: So what do I do, nothing?
Malak/God: For now, you can watch.
~~
You can watch.
You can watch as I tear this research up.
Clark, R.E. Media will never influence learning. ETR&D 42, 21–29 (1994). https://doi.org/10.1007/BF02299088
#edtech #research #VR #VReducation #VRResearch #TooGoodToBeTrue #MediaWillNeverInfluenceLearning #InstructionalDesign
This is a copy of the article I published on Linked In on August 17, 2021
This post was edited on April 11, 2026. The font was improved and the images re-placed. Slight editing of content.


.png)